
Linearization Checker (Calculus) – Interactive Tangent Approximation Tool
Loading the math board and drawing, please wait…
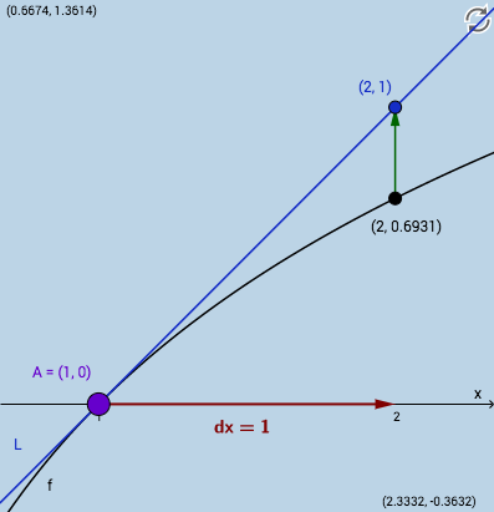
① This applet demonstrates the linearization of a function in calculus, allowing users to input a function, a center a, and an increment dx to see how the tangent line approximates the function locally. ② Core mathematical concepts include derivatives, tangent lines, linear approximation, local linearity, and error estimation. ③ Construction highlights: uses GeoGebra commands Tangent, Slope, Intersect, Textfield, Vector, Distance, and Segment, with input boxes and text objects to create an interactive checker. ④ Suitable for university calculus courses or AP Calculus, this tool helps students visualize and verify linear approximations and understand the role of the derivative in local behavior.
GeoGebra Commands & Parameters
Tangent(A, f) → gSlope(g) → mIntersect(g, h) → CTextfield(a) → InputBox1Textfield(deltax) → InputBox2Textfield(f) → InputBox3Intersect(h, i) → DVector(A, D) → dxDistance(A, D) → distanceADSegment(D, B) → jSegment(B, C) → kVector(B, C) → u
AI Drawing Prompt Reference
Draw the linearization of a function f at point a. First, input the function f, the center point a, and the increment deltax. Draw the tangent line g of f at point a and show its slope m. Then, find the intersection point C of g and the x-axis. Input box 1 for the x-coordinate of point a, and input box 2 for the value of deltax. Draw the vector dx from point A to point D, and calculate the distance distanceAD between A and D. Draw line segments j from D to B and k from B to C, and show their vectors u.
The prompt above was compiled from the original drawing commands and is for reference only.