
Linear Transformations of Curves
Loading the math board and drawing, please wait…
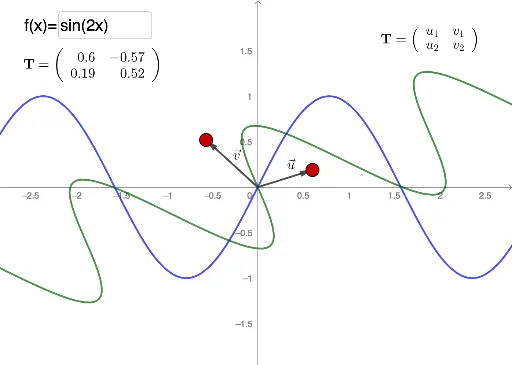
This example demonstrates how to change the shape and position of a curve through linear transformations. Key mathematical concepts include matrix transformations and coordinate geometry. Using commands like Intersect, Vector, CurveCartesian, and ApplyMatrix, the transformed curve can be constructed. Suitable for high school math education and learning linear algebra concepts of transformations.
GeoGebra Commands & Parameters
Intersect(xAxis, yAxis) → OVector(O, A) → uVector(O, B) → vCurveCartesian(t, f(t), t, -20, 20) → aApplyMatrix(T, a) → a'Textfield(f) → InputBox1
AI Drawing Prompt Reference
Draw a coordinate plane with the origin at the intersection of the axes. From the origin, draw two vectors pointing to two distinct points, serving as basis vectors. Plot a curve defined by a function over the x-range from -20 to 20. Then apply a linear transformation matrix to this curve, resulting in a new curve with altered shape and position. Finally, place an input box near the graph to adjust the function expression, allowing dynamic observation of the transformation effect.
The prompt above was compiled from the original drawing commands and is for reference only.