
Linear Relationships: Graphing Slope Types
Loading the math board and drawing, please wait…
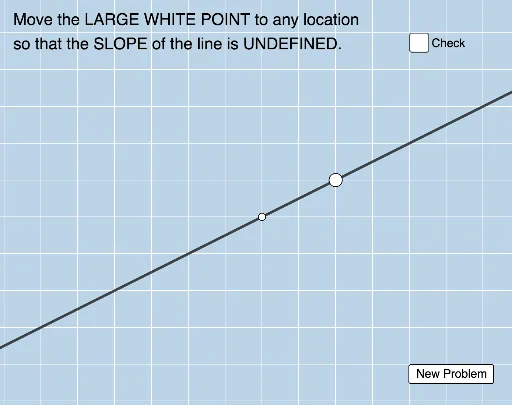
This example demonstrates how to graph different types of slopes in a coordinate system, focusing on linear functions and their graphical representations. Key math concepts include slope calculation, geometric transformations like reflections and similarity transformations. Constructed using GeoGebra commands such as PointIn, Line, Slope, and Random. Suitable for middle school and above students learning about linear function characteristics and slope applications.
GeoGebra Commands & Parameters
PointIn(a) → BLine(A, B) → fSlope(f) → bRandom(1, 4) → c