
Linear Mapping Visualization
Loading the math board and drawing, please wait…
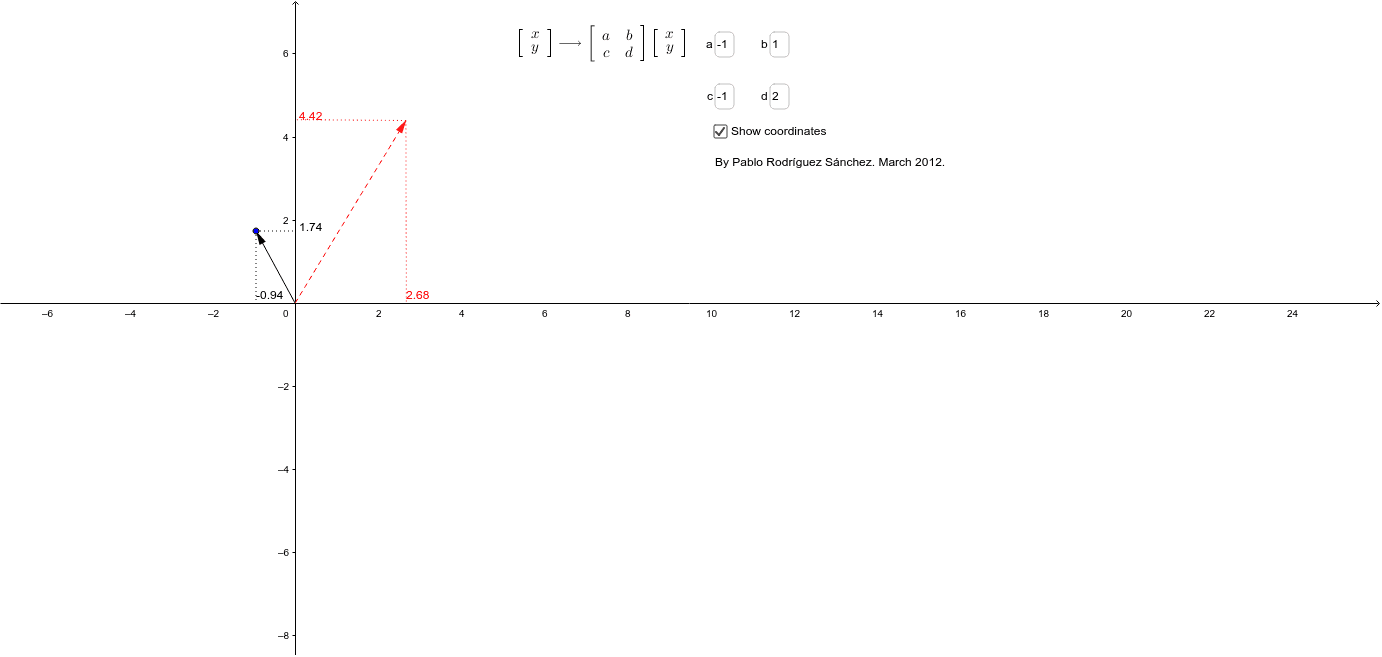
This example demonstrates the visualization of a linear mapping as a function whose input and output are both vectors. Key math concepts include linear mappings, vectors, and functions. It is constructed using GeoGebra commands like Intersect, Vector, Textfield, Point, and Segment, making it suitable for high school and above students learning fundamental linear algebra concepts.
GeoGebra Commands & Parameters
Intersect(xAxis, yAxis) → AVector(A, B) → uTextfield(a) → inputBox1Textfield(b) → inputBox2Textfield(c) → inputBox3Textfield(d) → inputBox4Point(v) → CSegment(C, D) → CoordsVyPoint(CoordsVy) → EPoint(xAxis) → FPoint(CoordsVy) → GSegment(G, H) → CoordsVxSegment(B, I) → CoordsUxSegment(B, J) → CoordsUy
AI Drawing Prompt Reference
Visualize a linear mapping as a function with vector inputs and outputs. Start by plotting the intersection of the coordinate axes, then create a vector. Set up four text fields for the coefficients of the linear mapping. Draw a point and connect it to the vector's origin to form a segment, marking the intersection points with the axes. Finally, based on the input coefficients and vector, draw the mapped vector and its components along the axes.
The prompt above was compiled from the original drawing commands and is for reference only.