
Linear Inequality Solution Practice with Random Generation by Mathguru
Loading the math board and drawing, please wait…
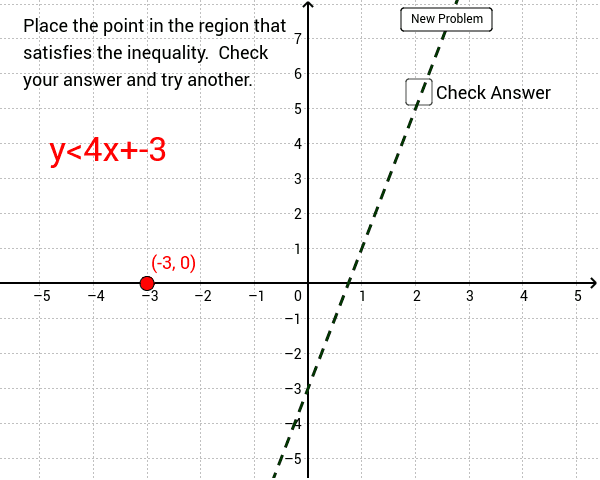
This GeoGebra example demonstrates the dynamic visualization of solution sets for linear inequalities on a Cartesian coordinate plane and number line. Core mathematical concepts include linear inequalities in one variable, inequality direction, solution intervals, open and closed boundary points, and real-number line representation. The construction uses the GeoGebra Random command to generate parameters m, b, a, and constant c, forming inequality expressions text1 through text4, with point A and button1 enabling problem regeneration and answer checking. It is suitable for middle school mathematics (grades 7–9) and high school review, supporting repeated practice and self-paced learning of linear inequality solutions.
GeoGebra Commands & Parameters
Random(-5, 5) → mRandom(-5, 5) → b
AI Drawing Prompt Reference
Create a dynamic practice figure for one-variable linear inequalities that shows solution sets on both a Cartesian coordinate plane and a number line. Randomly generate slope, intercept, coefficient, and constant parameters, then display several inequality expressions and indicate the inequality direction. Represent solution intervals with open or closed boundary points, and draw the corresponding line or shaded region on the coordinate plane. Add an interactive point and a button that can regenerate the problem and check the answer.
The prompt above was compiled from the original drawing commands and is for reference only.