
Linear Inequality Solution Demo
Loading the math board and drawing, please wait…
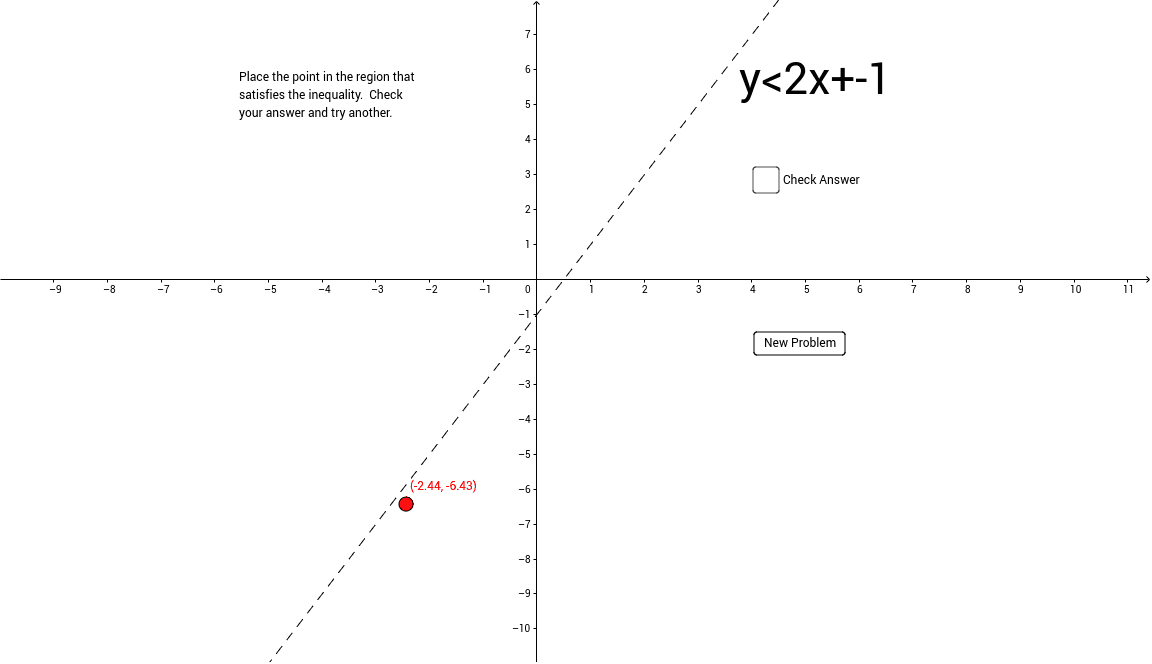
This example demonstrates dynamically visualizing the solution set of linear inequalities using GeoGebra. It involves core math concepts like inequalities, coordinate geometry, and number line representation. Construction highlights include using Random commands to generate coefficients m, b, a, and objects like text1, A, text2, text3, text4, and button1 for interactive control. Suitable for high school students and teachers for visualizing and understanding inequality solving techniques.
GeoGebra Commands & Parameters
Random(-5, 5) → mRandom(-5, 5) → b
AI Drawing Prompt Reference
Draw a dynamically changing line in a coordinate system where the slope and y-intercept are randomly generated, showing the solution set area of the inequality, along with interactive buttons and text labels to visually demonstrate the process of solving linear inequalities.
The prompt above was compiled from the original drawing commands and is for reference only.