
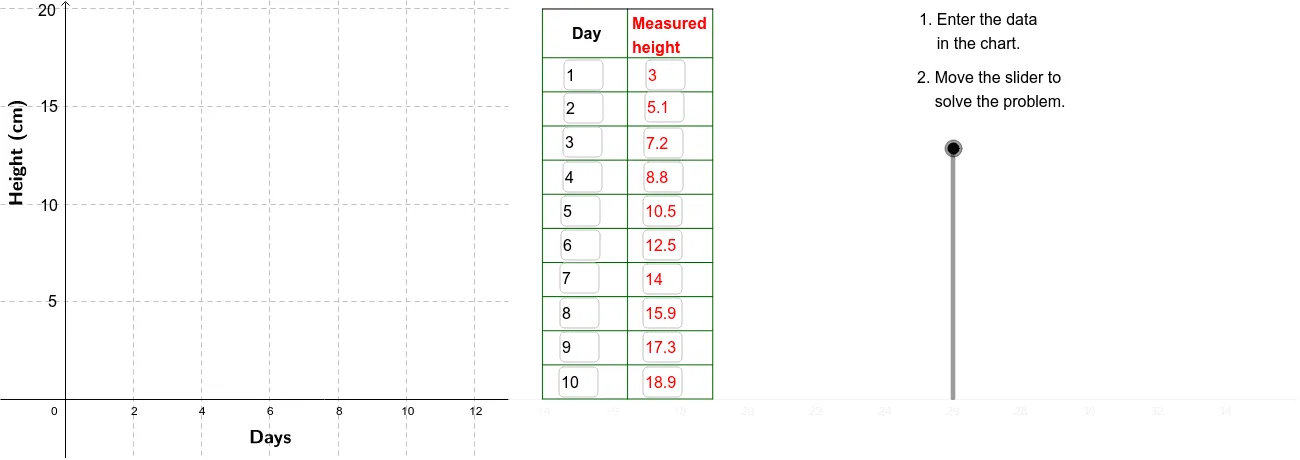
Linear Growth of Plant Height Over 10 Days
Loading the math board and drawing, please wait…
In collections
CCSS IP Math I Unit 4 Lesson 2
This example shows a linear growth trend of a plant's height recorded daily for ten days. It illustrates key concepts such as linear functions, sequences, coordinate geometry, and function graphing. The construction uses GeoGebra commands Sequence to generate the day indices, Textfield for data display, Segment to connect consecutive data points into a polyline, and Polygon with VerticalText for labeling; the objects involved are point sets A1‑A11, B1‑B11, C1‑C11, and D1‑D7. It is suitable for middle‑school algebra and function lessons, high‑school sequence and coordinate geometry review, and as an introductory data‑visualization resource.
GeoGebra Commands & Parameters
Sequence(Segment[(11.5, (5 * i)), (12.5, (5 * i))], i, 1, 4) → TickListTextfield(A2) → InA2Textfield(A3) → InA3Textfield(A4) → InA4Textfield(A5) → InA5Textfield(A6) → InA6Textfield(A7) → InA7Textfield(A8) → InA8Textfield(A9) → InA9Textfield(A10) → InA10Textfield(A11) → InA11Textfield(B2) → InB2Textfield(B3) → InB3Textfield(B4) → InB4Textfield(B5) → InB5Textfield(B6) → InB6Textfield(B7) → InB7Textfield(B8) → InB8Textfield(B9) → InB9Textfield(B10) → InB10Textfield(B11) → InB11Sequence(Segment[(14, 0 + (1.75 * i)), (19, 0 + (1.75 * i))], i, 0, 10) → CrossList1Sequence(Segment[(19, 0 + (1.75 * i)), (21.5, 0 + (1.75 * i))], i, 0, 10) → CrossList2Sequence(Segment[(21.5, 0 + (1.75 * i)), (24, 0 + (1.75 * i))], i, 0, 10) → CrossList3Sequence(Segment[(14 + (2.5 * i), 0), (14 + (2.5 * i), 20)], i, 0, 2) → SideList1Segment((14, 20), (19, 20)) → Top1Segment((19, 20), (21.5, 20)) → Top2Segment((21.5, 20), (24, 20)) → Top3Segment((21.5, 0), (21.5, 20)) → Side2Segment((24, 0), (24, 20)) → Side3Polygon((13, y(Corner[1])), Corner[2], Corner[3], (13, y(Corner[4]))) → poly1, b, c, d, eSegment((0, 10), (13, 10)) → ResidualAxisVerticalText("Height (cm)") → HeightSegment((-2, 0), (13.08807, 0)) → CoverAxis