
Linear Function Problem: Cost of T-Shirts
Loading the math board and drawing, please wait…
In collections
Introduction to Linear Functions and Graphs
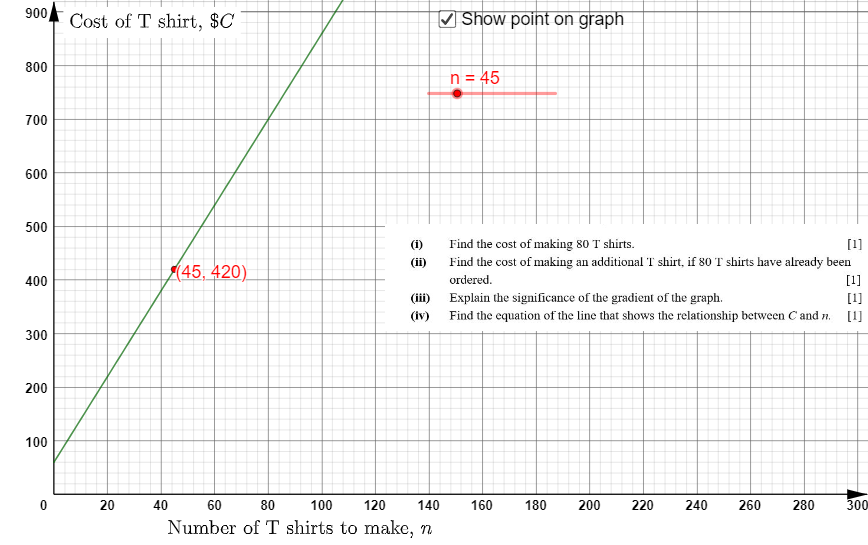
This example demonstrates the cost variation of T-shirts using linear functions. Key mathematical concepts include linear functions and their graphs. Using GeoGebra commands such as constructing lines, slider animations, and function graphs, students can visually understand the properties of linear functions. Suitable for middle school and above students to learn the application of linear functions.
GeoGebra Commands & Parameters
Ray(A, B) → f
AI Drawing Prompt Reference
Draw a graph of a linear function to show the variation in T-shirt costs, using a ray to represent the function's graph and adding a slider to dynamically adjust parameters, visually demonstrating the properties and changes of the linear function's graph.
The prompt above was compiled from the original drawing commands and is for reference only.