
Linear Equations and Function Graphs
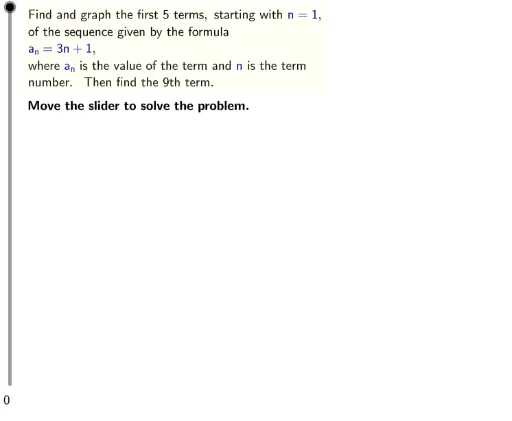
Loading the math board and drawing, please wait…
This example demonstrates how to use GeoGebra to graph systems of linear equations and analyze their solutions. Key mathematical concepts include linear equations, function graphs, and continuity. Using commands like LaTeX, Sequence, and TableText, users can dynamically adjust coefficients and observe changes in the solutions. Suitable for high school mathematics education and learning.
GeoGebra Commands & Parameters
LaTeX(steps) → counterLaTeX("\text{Move the slider to solve the problem.}") → text0LaTeX("\text{Use the buttons below to return to the original}\cr\text{problem or randomly generate a similar practice}\cr\text{problem.}") → RandomizationTextCorner(2, 3) → toprightCorner(2, 1) → bottomleftIf(const > 0, "+", "-") → constSignIf(choose ≟ 0, LaTeX[(((("a_n=" * coef) * "n") * constSign) * absConst)], LaTeX[(((((("a_n=" * coef) * "a_{n-1}") * constSign) * absConst) * "\text{ and }a_0=") * const)]) → formulaIf(choose ≟ 0, explicit, recursive) → sequenceValsSequence((n(j), sequenceVals(j)), j, 1, graphterms) → plotPointsLaTeX("\text{Determine whether this is an explicit formula or a}\cr\text{recursive formula.}") → text1LaTeX((((((("\text{Find and graph the first " * graphterms) * " terms, starting with }\textcolor{#000099}{n=1}\text{,}\cr\text{of the sequence given by the formula }\cr\textcolor{#000099}{") * formula) * "}\text{,}\cr\text{where }\textcolor{#000099}{a_n}\text{ is the value of the term and }\textcolor{#000099}{n}\text{ is the term}\cr\text{number. Then find the ") * finalterm) * "th term.}")) → ProblemIf(choose ≟ 0, LaTeX["\text{This is an explicit formula because the right hand}\cr\text{side depends only on }\textcolor{#000099}{n}\text{ and not on }\textcolor{#000099}{a_{n-1}}\text{ or similar}\cr\text{terms.}"], LaTeX["\text{This is a recursive formula because the right hand}\cr\text{side depends on }\textcolor{#000099}{a_{n-1}}\text{ and we are given an initial}\cr\text{term, }\textcolor{#000099}{a_0}\text{.}"]) → text2LaTeX((("\text{Find the first " * graphterms) * " terms of the sequence.}")) → text3If(choose ≟ 0, Sequence[LaTeX[(((((((((("a_" * k) * "=") * coef) * "(") * k) * ")") * constSign) * absConst) * "=") * sequenceVals(k))], k, 1, graphterms], Append[LaTeX[(((((((("a_1=" * coef) * "(") * const) * ")") * constSign) * absConst) * "=") * sequenceVals(1))], Sequence[LaTeX[(((((((((("a_" * k) * "=") * coef) * "(") * sequenceVals(k - 1)) * ")") * constSign) * absConst) * "=") * sequenceVals(k))], k, 2, graphterms]]) → firstTermsLaTeX((("\text{Substitute the respective values for }\textcolor{#000099}{n=1}\text{ through }\cr\textcolor{#000099}{n=" * graphterms) * "}\text{.}")) → text4LaTeX(formula) → text4bTableText({firstTerms}, "v") → text4cSequence(sequenceVals(k), k, 1, graphterms - 1) → shortListLaTeX("\text{Create ordered pairs from the sequence.}") → text5LaTeX("\text{The first coordinate is }\textcolor{#000099}{n}\text{ and the second coordinate}\cr\text{is }\textcolor{#000099}{a_n}\text{.}") → text6LaTeX("\text{Plot the ordered pairs.}") → text8LaTeX((("\text{Find the " * finalterm) * "th term in the sequence.}")) → text9If(choose ≟ 0, LaTeX[(((("\text{Since the sequence is explicitly defined, evaluate}\cr\text{the formula, }\textcolor{#000099}{" * formula) * "}\text{ at }\textcolor{#000099}{n=") * finalterm) * "}\text{.}")], LaTeX[(("\text{Since the sequence is recursively defined, continue}\cr\text{building up to the " * finalterm) * "th term one term at a time.}")]) → text10aSequence(sequenceVals(k), k, 1, graphterms) → graphedListMax(0, Max[graphedList]) → maxySequence(LaTeX[(((((((((("a_" * k) * "=") * coef) * "(") * sequenceVals(k - 1)) * ")") * constSign) * absConst) * "=") * sequenceVals(k))], k, graphterms + 1, finalterm) → moreTermsIf(choose ≟ 0, LaTeX[(((((((((("a_" * finalterm) * "=") * coef) * "(") * finalterm) * ")") * constSign) * const) * "=") * sequenceVals(finalterm))], TableText[{moreTerms}, "v"]) → text10bLaTeX((((("\text{The " * finalterm) * "th term in the sequence is ") * sequenceVals(finalterm)) * ".}")) → text10cLaTeX((((((("\text{" * text10a) * "}\cr\textcolor{#000099}{") * text10b) * "}\cr\text{") * text10c) * "}")) → text10LaTeX((((((("\text{The first " * graphterms) * " values are ") * shortList) * "}\cr\text{and ") * sequenceVals(graphterms)) * ".}")) → text4dTableText({Append[LaTeX["(n,a_n)"], plotPoints]}, "v") → text7Min(0, Min[graphedList]) → miny