
Linear Equation Anatomy: Slope, Intercept, and Graph
Loading the math board and drawing, please wait…
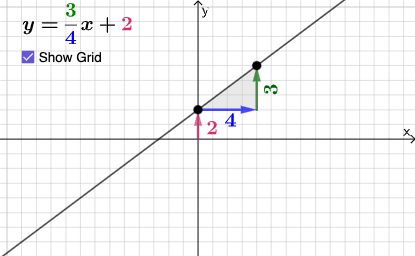
This example demonstrates the geometric representation of linear equations. Key mathematical concepts include slope, intercept, vectors, and function graphs. Construction involves GeoGebra commands such as Point, Line, Vector, Polygon, and RotateText to create lines, points, vectors, and text annotations. Suitable for middle or high school mathematics to understand basic properties of linear functions and graphical transformations.
GeoGebra Commands & Parameters
Point(x = 0) → ALine(A, B) → fVector(A, C) → uVector(C, B) → vPolygon(A, C, B) → t1, b, a_1, cRotateText(text2, pi / 2) → text3Vector((0, 0), A) → w
AI Drawing Prompt Reference
Draw a line graph with a vector from the origin to a point on the line and another vector parallel to the line from that point, forming a triangle with the origin. Label the origin on the line and the arrow on the parallel vector. Annotate the slope and intercept of the line with text, and display rotated text at the intercept point at a 90-degree angle.
The prompt above was compiled from the original drawing commands and is for reference only.