
Line Integral Visualization
Loading the math board and drawing, please wait…
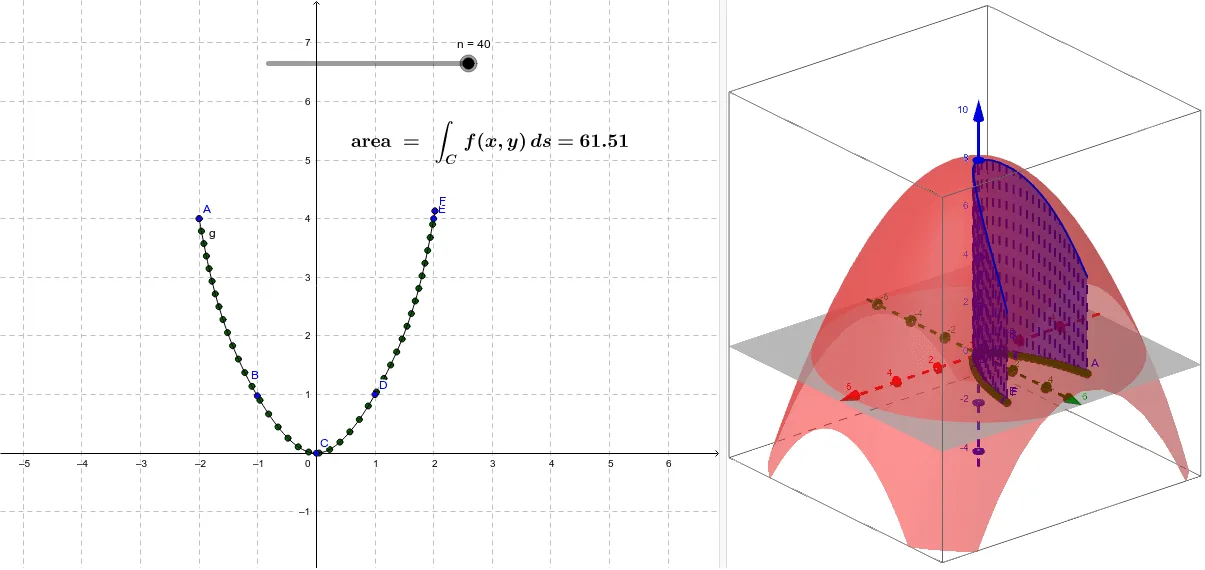
This example demonstrates the concept of line integral by integrating along a curve in coordinate geometry. Key mathematical concepts include integration and curves. It uses GeoGebra commands such as Spline, Sequence, and Sum to construct the curve and calculate the integral. Suitable for university calculus courses.
GeoGebra Commands & Parameters
Spline({A, B, C, D, E, F}, 3) → gSequence(g(t), t, 0, 1, 1 / n) → pointsSequence((x(Element[points, k]), y(Element[points, k]), f(Element[points, k])), k, 1, n + 1, 1) → list1Sequence(g(t) + (0, 0, 0), t, 0, 1, 1 / n) → ptsSequence(Polygon[Element[pts, k], Element[list1, k], Element[list1, k + 1], Element[pts, k + 1]], k, 1, n) → list2Sum(Sequence[Area[Element[list2, k]], k, 1, n - 1]) → area
AI Drawing Prompt Reference
Create a cubic spline curve g using points A, B, C, D, E, and F. Divide the curve into n segments to generate a series of points, forming a point list points. Then, divide the curve into points to form another point list list1. Use these points to construct a series of small polygons, and finally calculate the total area of these polygons to obtain the line integral area.
The prompt above was compiled from the original drawing commands and is for reference only.