
Limits & Infinity Graph
Loading the math board and drawing, please wait…
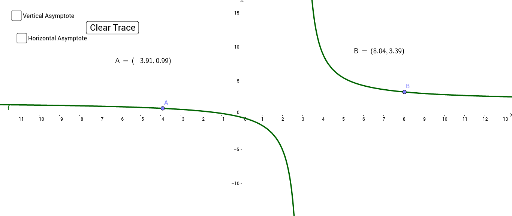
This example demonstrates the graphical representation of functions under limits and infinity. It involves core math concepts like limits, parabolas, dilation, linear regression, rectangles, and quadratic functions. Constructed using GeoGebra commands Point, LaTeX, and objects such as f, A, g, B, text1, text2, button3, h, a, b. Suitable for high school and above students to understand limit theory and function image transformations.
GeoGebra Commands & Parameters
Point(f) → APoint(f) → BLaTeX(A, true, true) → text1LaTeX(B, true, true) → text2
AI Drawing Prompt Reference
Draw a function graph to demonstrate the concepts of limits and infinity. First, draw a parabola, then select two points A and B on the parabola, and use LaTeX to label their coordinates as text.
The prompt above was compiled from the original drawing commands and is for reference only.