
Continuity Condition 2: Geometric Demonstration of Function Continuity
Loading the math board and drawing, please wait…
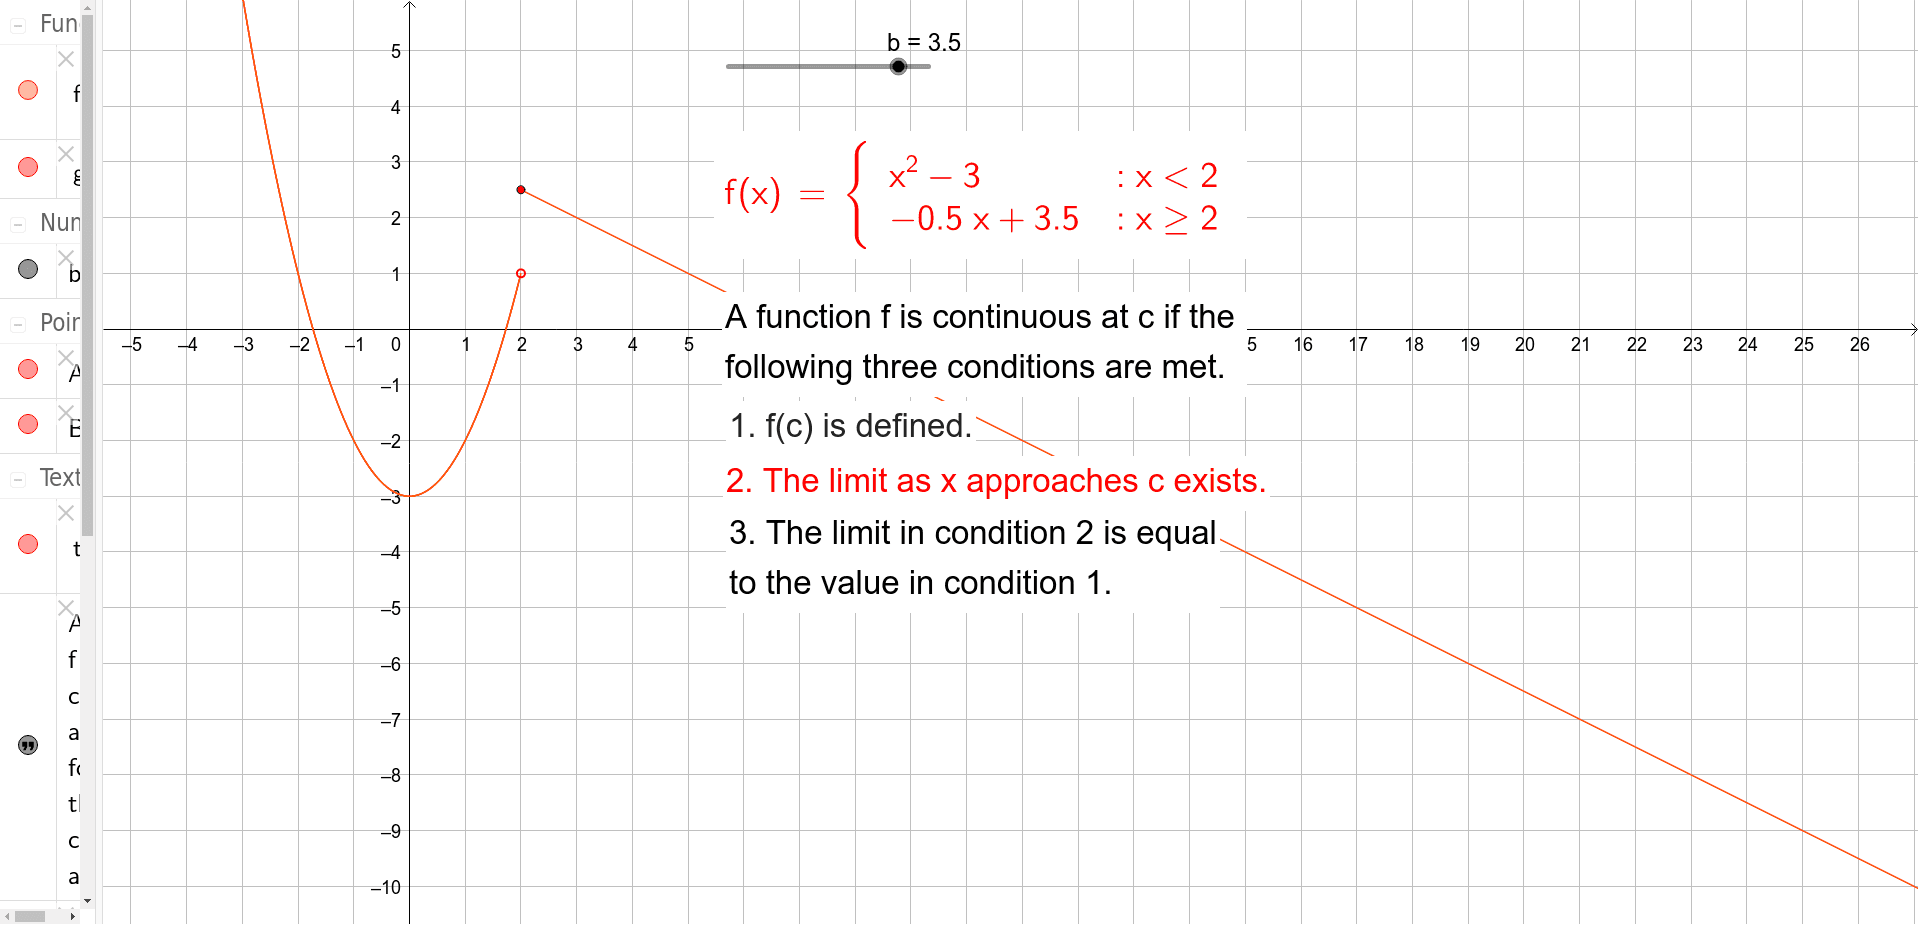
This example demonstrates the geometric conditions for function continuity at a point. Key concepts involve limits, function values, and left/right limits. Construction utilizes GeoGebra Point objects, lines, function graphs, and LaTeX text for annotations. Ideal for high school advanced math or introductory calculus students to visualize the definition of continuity.
GeoGebra Commands & Parameters
Point({2, 1}) → APoint({2, b - 1}) → BLaTeX(f, true, true) → text1
AI Drawing Prompt Reference
Create a geometric demonstration of function continuity at x=2, showing the function value at this point, a horizontal line representing it, and lines indicating left and right limits, with LaTeX annotations for the function expression and key concepts, illustrating the relationship between limits, function values, and left/right limits for advanced high school or introductory calculus students to understand the definition of continuity.
The prompt above was compiled from the original drawing commands and is for reference only.