
Continuity Challenge
Loading the math board and drawing, please wait…
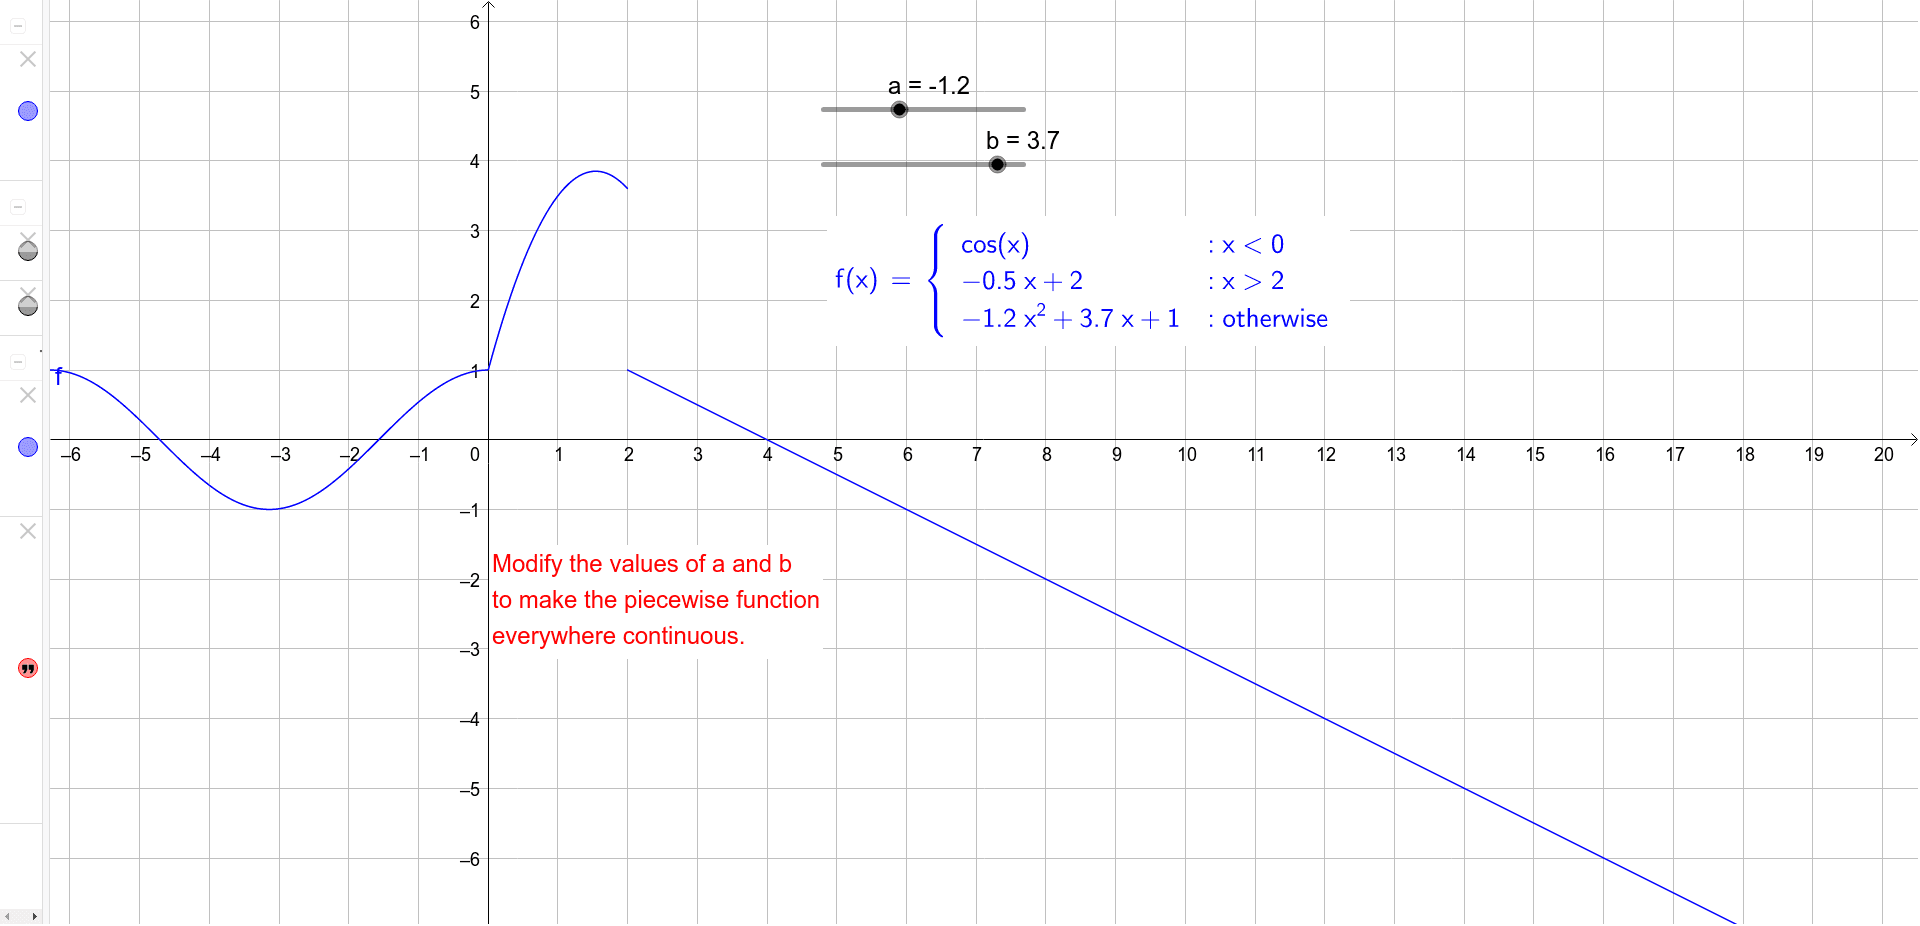
This example demonstrates the concept of continuity by exploring the intersection of random variables and exponential functions, focusing on the properties of isosceles triangles. It uses GeoGebra commands like LaTeX to label key points and objects such as a, b, and f to construct the graph. Suitable for high school mathematics education and learning.
GeoGebra Commands & Parameters
LaTeX(f, true, true) → text1
AI Drawing Prompt Reference
Draw a graph illustrating continuity, featuring an isosceles triangle and an exponential function. The triangle has two equal sides and a base, with the exponential function plotted on it. Key points like a and b mark the triangle vertices, and f represents the exponential curve. Construction order: first draw the isosceles triangle, then plot the exponential function, and finally label key points to highlight the continuity relationship.
The prompt above was compiled from the original drawing commands and is for reference only.