
Measuring Functions - Ln(x): Visualizing the Natural Logarithm
Loading the math board and drawing, please wait…
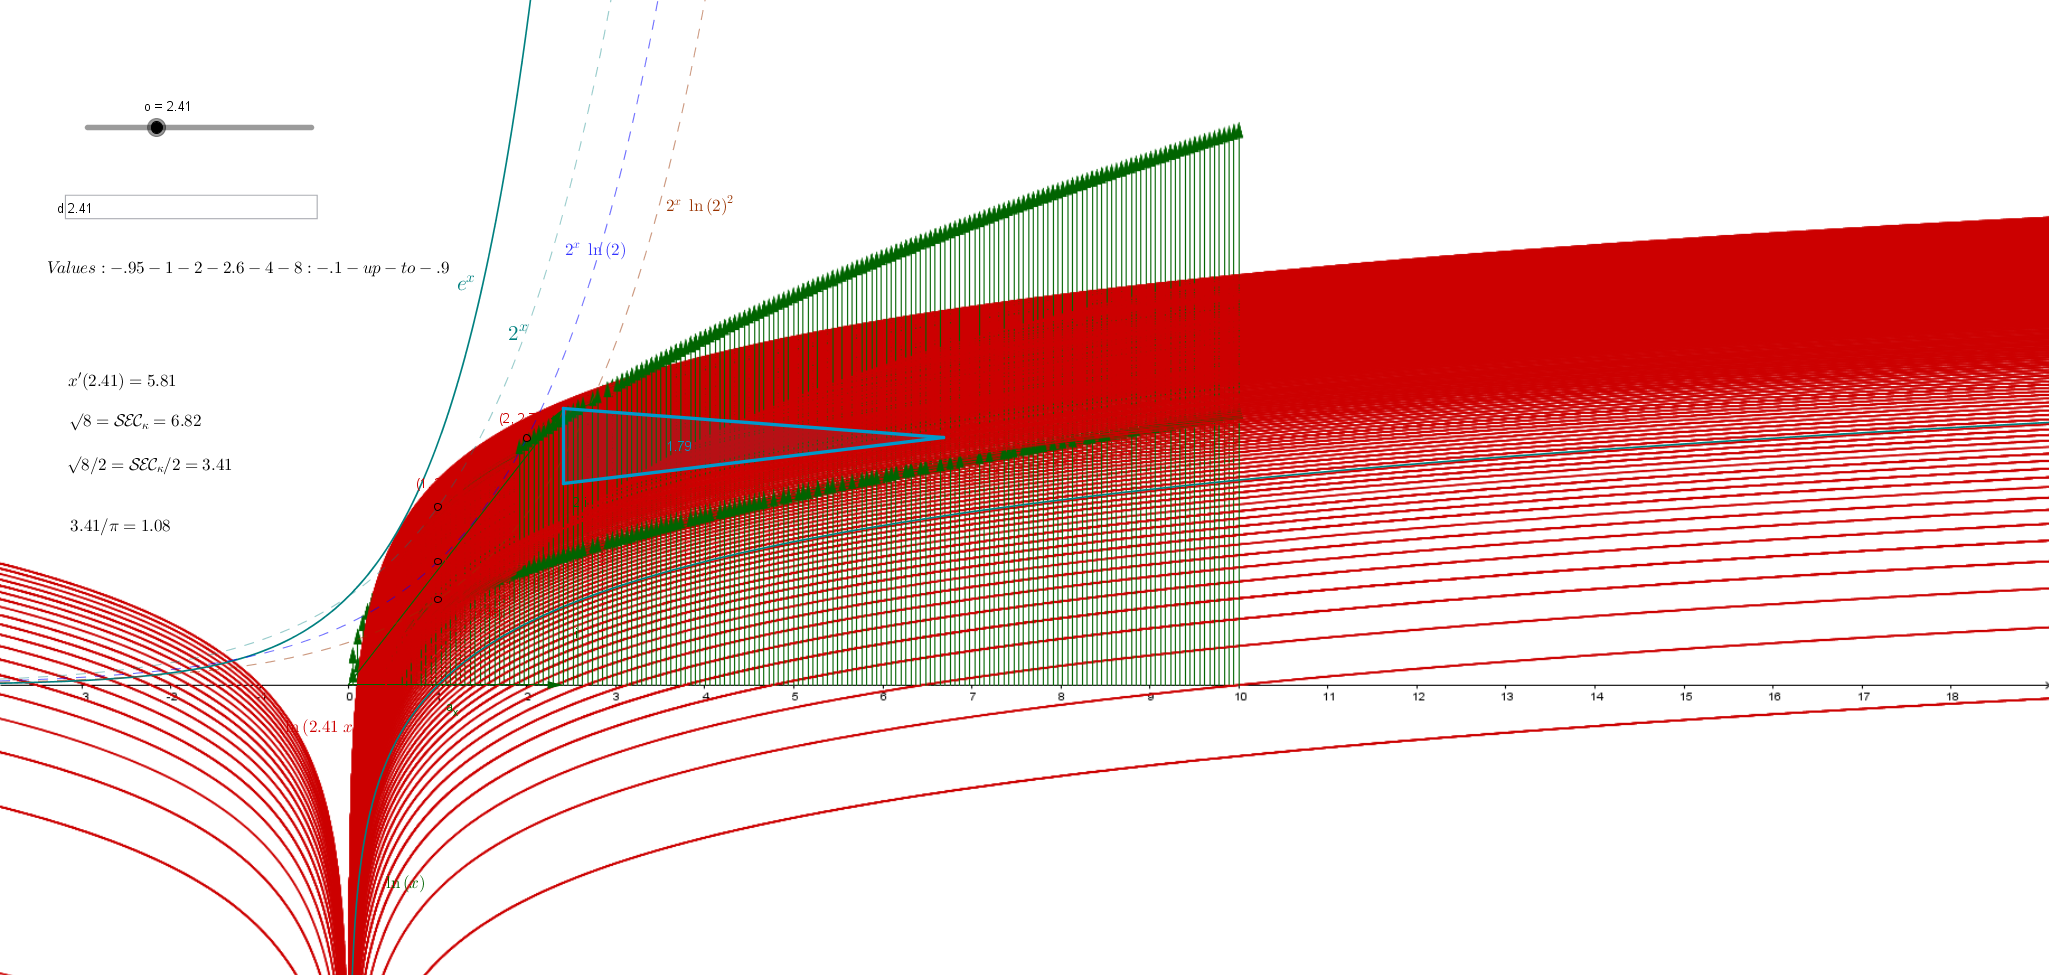
This GeoGebra example dynamically illustrates the graph of the natural logarithm function Ln(x), showing its domain, monotonic increase, vertical asymptote at x=0, and how function values change with the input. The core mathematical concepts include logarithmic functions, graphing, limits, and continuity. Construction details: based on the summary, it uses point objects A and B, and an image object pic1, likely for plotting key points or embedding a reference picture, combined with the function command to draw the Ln(x) curve. This is suitable for high school or early college students learning calculus or precalculus, helping them grasp the geometric meaning of logarithms and function measurement. It also serves as an effective classroom demonstration tool for teachers to connect algebraic expressions with visual graphs.
GeoGebra Commands & Parameters
Point A(-4.24, -7.72)Point B(25.0, -7.98)