
Holes in Rational Functions: Visualizing Removable Discontinuities
Loading the math board and drawing, please wait…
In collections
Rational Functions
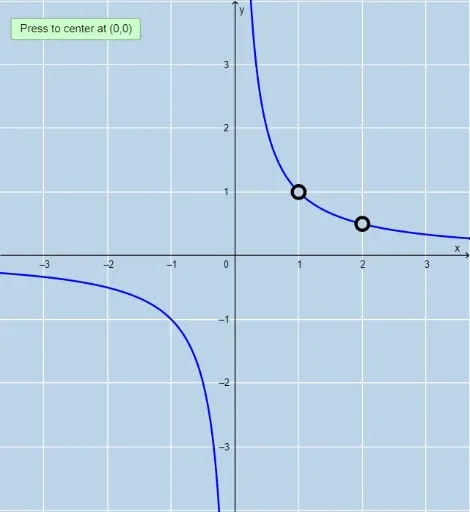
This GeoGebra example dynamically visualizes the formation and location of 'holes' (removable discontinuities) in rational function graphs. The core mathematical concepts involve factoring polynomials, canceling common factors, and understanding points where a function is undefined yet has a finite limit. Construction highlights: using Root and Intersection commands to find zeros of numerator and denominator, Sequence and Length to identify common roots, Limit to verify the function's limiting value at the hole, and Textfield/InputBox for interactive parameter input. The final graph marks hole positions with points and line segments. Suitable for high school to early college students studying continuity, limits, and rational functions, as well as for teachers demonstrating the difference between holes and vertical asymptotes.
GeoGebra Commands & Parameters
Root(Denominator[r]) → A, B, CIntersection(rootsd, rootsm) → commonrootsLength(commonroots) → numberofholesSequence(x = x(Element[commonroots, i]), i, 1, numberofholes, 1) → linesSequence(x(Element[commonroots, i]), i, 1, numberofholes, 1) → xvalsSequence((Element[xvals, i], r(Element[xvals, i])), i, 1, numberofholes, 1) → holesSequence(Limit[r, Element[xvals, i]], i, 1, numberofholes, 1) → list1Sequence((Element[xvals, i], Element[list1, i]), i, 1, numberofholes, 1) → list2Limit(r, Infinity) → aLimit(r, -Infinity) → bTextfield(n) → InputBox1Textfield(d) → InputBox2PartialFractions(r) → pSequence((Element[xvals, i], Element[list1, i]), i, 1, numberofholes, 1) → l1