
Graphs of Rational Functions (Part 2): IM Alg2.2.18 Lesson
Loading the math board and drawing, please wait…
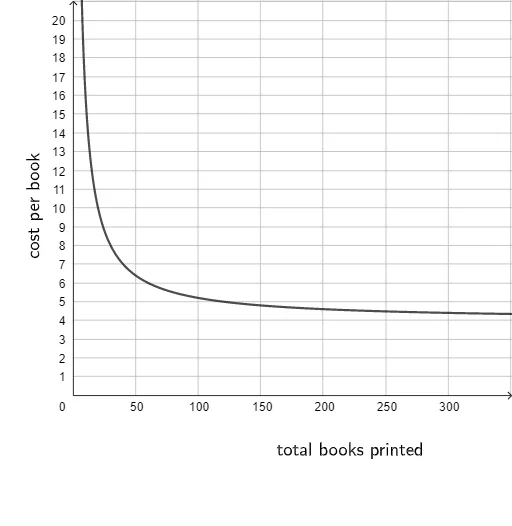
This example demonstrates key features of rational function graphs, including asymptotes, discontinuities, and behavior near special points. The core mathematical concepts involve domain restrictions, vertical and horizontal asymptotes, removable discontinuities, and overall graph shape. Construction notes: based on the summary, text objects (text1, text2) and a curve/point object (c) are used, likely for labeling key points or plotting the function curve, supporting step-by-step lesson explanations. Suitable for high school Algebra 2 students to understand graphing and analysis of rational functions, and useful for classroom demonstrations or self-study.
GeoGebra Commands & Parameters
c(x) = If[x > 0, (120 + (4 * x)) / x]
AI Drawing Prompt Reference
Draw the graph of a rational function defined by a piecewise rule: for x > 0, plot y = (120 + 4x) / x. Render only the part of the curve corresponding to the domain x > 0, and show the overall shape of the function as x changes within that region. Emphasize key features typical for rational graphs, such as behavior near special points and limit/asymptote-related trends, and include clear text annotations to highlight the domain restriction and the main analysis ideas, without introducing any additional conditions beyond the x>0 definition.
The prompt above was compiled from the original drawing commands and is for reference only.