
Finding a tricky limit two ways
Loading the math board and drawing, please wait…
In collections
Theorems of Differential Calculus
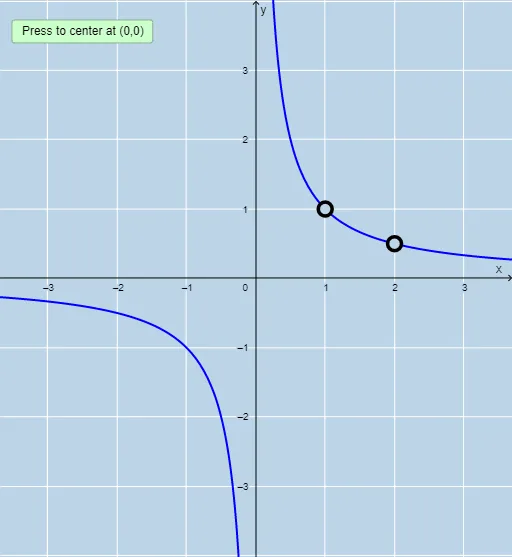
This example demonstrates solving a tricky limit problem using two methods. Key mathematical concepts include limits, functions, and inequalities. GeoGebra commands used include Root, Intersection, Length, Sequence, and Limit. Suitable for high school mathematics education and learning.
GeoGebra Commands & Parameters
Root(Denominator[r]) → A, B, CIntersection(rootsd, rootsm) → commonrootsLength(commonroots) → numberofholesSequence(x = x(Element[commonroots, i]), i, 1, numberofholes, 1) → linesSequence(x(Element[commonroots, i]), i, 1, numberofholes, 1) → xvalsSequence((Element[xvals, i], r(Element[xvals, i])), i, 1, numberofholes, 1) → holesSequence(Limit[r, Element[xvals, i]], i, 1, numberofholes, 1) → list1Sequence((Element[xvals, i], Element[list1, i]), i, 1, numberofholes, 1) → list2Limit(r, Infinity) → aLimit(r, -Infinity) → bTextfield(n) → InputBox1Textfield(d) → InputBox2PartialFractions(r) → pSequence((Element[xvals, i], Element[list1, i]), i, 1, numberofholes, 1) → l1
AI Drawing Prompt Reference
Draw a rational function's limit analysis diagram. Show the function curve on a coordinate system, focusing on removable discontinuities where the denominator equals zero but the numerator also equals zero. Use dashed vertical lines to mark these x-coordinates and label the limit values approaching each point. Also display the limits at positive and negative infinity. The diagram presents the function curve with its key limit characteristics, illustrating different methods of calculating limits.
The prompt above was compiled from the original drawing commands and is for reference only.