
Exponential Function: Properties and Graph
Loading the math board and drawing, please wait…
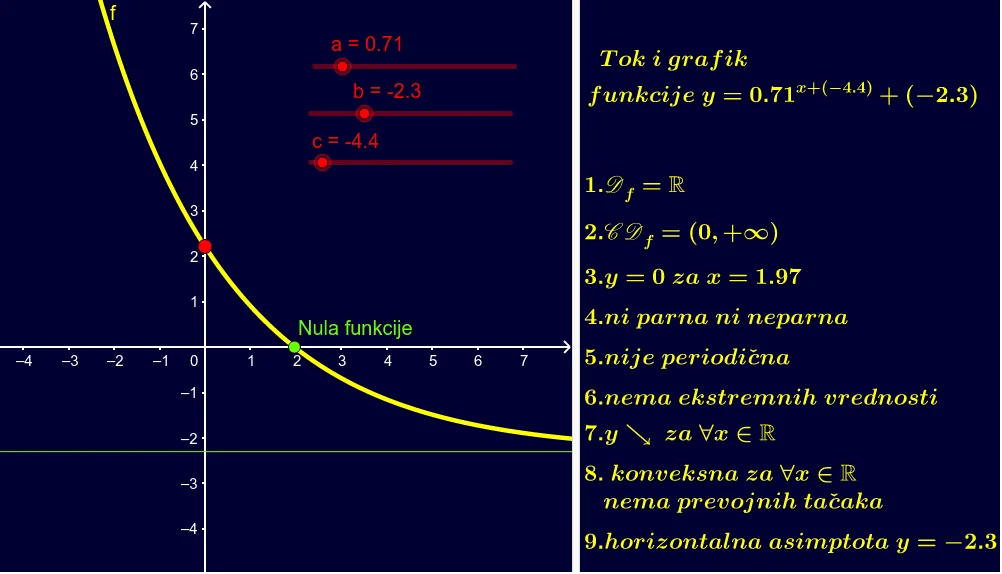
①This GeoGebra example dynamically displays the graph of an exponential function y=a^x (a>0, a≠1) and systematically lists its core properties: domain, range, monotonicity, parity, periodicity, extrema, convexity, and horizontal asymptote. ②Key mathematical concepts covered include exponential functions, domain and range, monotonicity, even/odd functions, periodicity, extrema, convexity, horizontal asymptotes, and the geometric interpretation of function properties. ③Construction highlights: The example uses GeoGebra commands Intersect and Roots to determine key points, and employs text objects (e.g., tekst1, tekst2) to display step-by-step property statements on the canvas. It also constructs the function f, parameters a, b, c, points A, B, C, and line d, allowing dynamic parameter changes to explore the graph. ④This resource is suitable for high school or pre-university students learning exponential functions, serving as a classroom demonstration or self-study tool to connect algebraic properties with graphical behavior.
GeoGebra Commands & Parameters
Intersect(f, yAxis, (0, 2.2129785114962077)) → ARoots(f, -30, 30) → B, C
AI Drawing Prompt Reference
Draw the graph of an exponential function y=a^x where a>0 and a≠1, dynamically display its image, and mark the intersection with the y-axis, as well as all roots of the function within the range of -30 to 30, using text objects to progressively show core properties like domain, range, monotonicity, parity, periodicity, extrema, convexity, and horizontal asymptote on the canvas.
The prompt above was compiled from the original drawing commands and is for reference only.