
Graph of Rational Functions: Asymptotes, Intercepts, and Holes
Loading the math board and drawing, please wait…
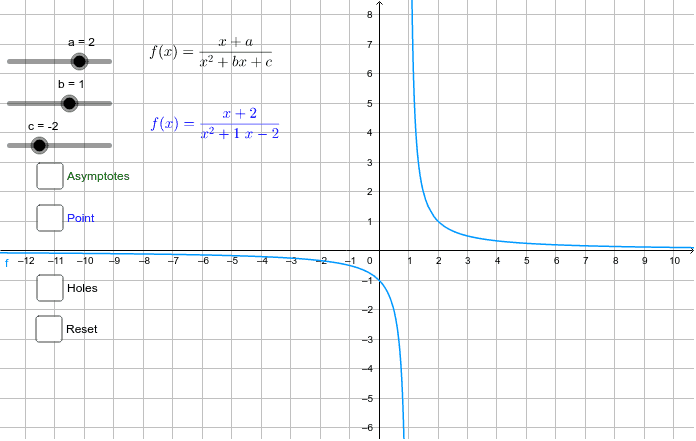
This GeoGebra example demonstrates a comprehensive analysis of rational function graphs, including vertical and horizontal asymptotes, intercepts with coordinate axes, and removable discontinuities (holes). The core mathematical concepts involve domain restrictions, end behavior, factorization and cancellation effects on the graph, and solving for asymptote equations. Construction highlights include using the Asymptote command to automatically generate asymptote lines, Factor to factor numerator and denominator for identifying common factors that create holes, Intersect to find intercepts, and Simplify to reduce expressions. Point objects and text labels are used to annotate key features. This resource is suitable for high school or pre-calculus students learning function properties, and for teachers demonstrating the intricate structure of rational function graphs in classroom settings.
GeoGebra Commands & Parameters
Asymptote(f) → list1Factor(x^(2) + (b * x) + c) → gIntersect(g, h, (-2.0000000012048265, 3.614479383914894E-9)) → BSimplify(f) → pIntersect(g, h, (2.0000000012048265, 4.000000006024132)) → A
AI Drawing Prompt Reference
Draw the complete graph of a rational function, showing its vertical and horizontal asymptotes, x-intercepts, and a hole. Start with the curve, then add a vertical dashed line and a horizontal dashed line for the asymptotes. Mark two solid points where the curve crosses the x-axis, one on the left and one on the right. Indicate the hole with an open circle at the point where the simplified function is undefined. Add text labels near the intercepts and the hole with their coordinates.
The prompt above was compiled from the original drawing commands and is for reference only.