
Function Transformation Exploration by Carlos-Vizcaino
Loading the math board and drawing, please wait…
In collections
Maths and Statistics Support
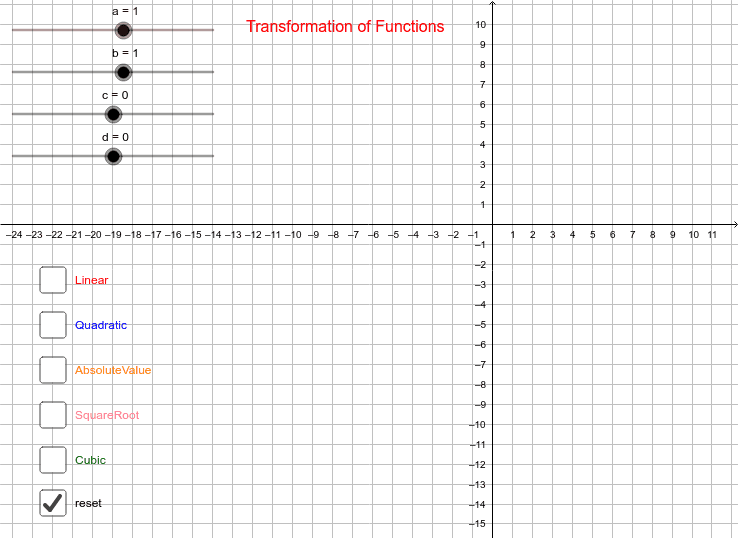
This example demonstrates the effects of transformations on function graphs through an interactive model, covering core concepts like function transformation rules, linear, quadratic, exponential, and trigonometric functions. It utilizes GeoGebra commands/objects such as a, b, c, d, f, g, Linear, Quadratic, Amplitude, Period, Frecuency, h, p, q, SquareRoot, AbsoluteValue, Cubic, text elements, and reset functions. Ideal for high school mathematics education to understand how transformations affect function graphs.
GeoGebra Commands & Parameters
Numeric a(1.0)Numeric b(1.0)Numeric c(0.0)Numeric d(0.0)f(x) = (a * ((b * x) - c)^(2)) + dg(x) = (a * ((b * x) - c)) + dBoolean Linear(false)Boolean Quadratic(false)abs(a)(2 * π / b)bh(x) = (a * sqrt((b * x) - c)) + dp(x) = (a * abs((b * x) - c)) + dq(x) = (a * ((b * x) - c)^(3)) + dBoolean SquareRoot(false)Boolean AbsoluteValue(false)Boolean Cubic(false)Boolean reset(true)Boolean reset_1(false)
AI Drawing Prompt Reference
Create an interactive function transformation exploration graph showing a quadratic curve and a straight line, both adjustable via parameters for translation, scaling, and reflection. Also include a square root curve, an absolute value V-shape, a cubic curve, and a sine or cosine wave with adjustable amplitude and period. All curves share the same coordinate system, with text labels explaining transformation parameters. Provide toggle buttons to show or hide each function type and a reset button to restore initial settings. The graph should clearly illustrate how parameter changes affect function shapes, suitable for high school teaching.
The prompt above was compiled from the original drawing commands and is for reference only.