
Left and Right Riemann Sums Visualization
Loading the math board and drawing, please wait…
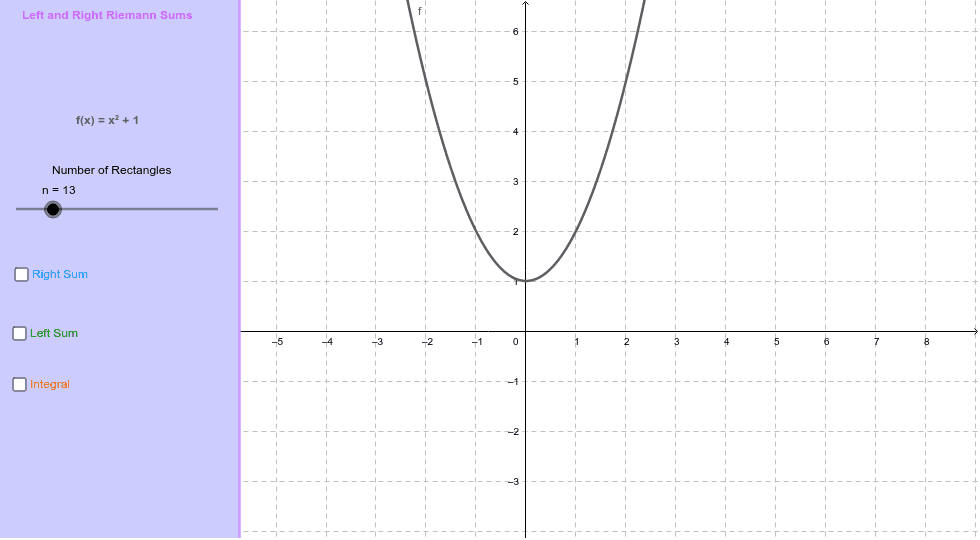
① This interactive GeoGebra example visually demonstrates left and right Riemann sums for a given function on a specified interval, illustrating how rectangular approximations approach the definite integral. ② Core mathematical concepts include Riemann sums, definite integrals, interval partitioning, rectangular approximation, and the limit process, fundamental to introductory calculus. ③ Construction details: The applet uses GeoGebra commands such as Point, Sequence, and Take to generate partition points and rectangle heights, CreatePanel for an interactive control panel, and Integral to compute the exact integral value. Objects include leftRect and rightRect for the rectangles, leftSum and rightSum for the sums, along with text1–text6 to display numerical results and explanations. ④ Suitable for high school advanced placement or university calculus courses, enabling students to explore how increasing the number of rectangles n improves approximation accuracy and builds intuition about limits and integration.
GeoGebra Commands & Parameters
Point(xAxis) → APoint(xAxis) → BSequence(x(A) + (i * dx), i, 0, n) → subintTake(subint, 1, n) → leftTake(subint, 2, n + 1) → rightSequence(Polygon[(Element[left, i], 0), (Element[right, i], 0), (Element[right, i], Element[rightheights, i]), (Element[left, i], Element[rightheights, i])], i, 1, n) → rightRectSequence(Polygon[(Element[left, i], 0), (Element[right, i], 0), (Element[right, i], Element[leftheights, i]), (Element[left, i], Element[leftheights, i])], i, 1, n) → leftRectCreatePanel(240) → poly1, aIntegral(f, x(A), x(B)) → Integral
AI Drawing Prompt Reference
Draw a function curve over a specified interval on the x-axis, with two endpoints marked. Divide the interval into n equal subintervals. Construct two sets of rectangles: one using left endpoints for heights, another using right endpoints. Display both rectangle sets, the exact integral value, and a slider to adjust n, showing how approximations improve as n increases.
The prompt above was compiled from the original drawing commands and is for reference only.