
Least Squares 2a
Loading the math board and drawing, please wait…
In collections
Exploring Orthogonality
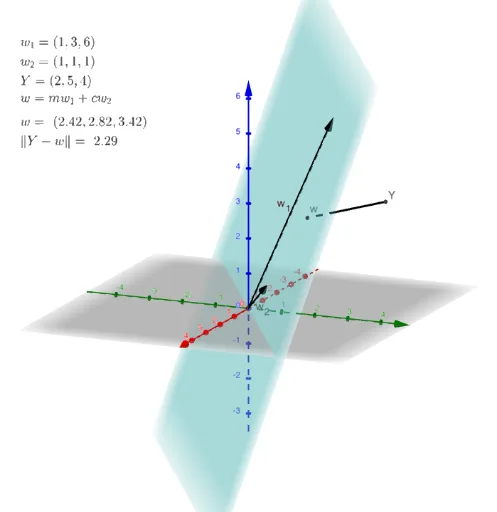
①This example demonstrates linear regression fitting of discrete data points using the method of least squares in a coordinate plane, visually showing the geometric meaning of minimizing the sum of squared residuals. ②Core mathematical concepts include least squares, linear regression, residuals (vertical distances), sum of squares optimization, and the geometric relationship between the fitted line and data points. ③Construction details: Uses GeoGebra commands Plane and Segment; objects include data points P1, P2, P3, weights w1, w2, vector v0, origin O, fitted line p, slope m, intercept b, and residual segments r1, r2, r3, etc., allowing dynamic adjustment of parameters to observe fitting effects. ④Suitable for high school to early college mathematics or statistics courses, helping students understand the principles of regression analysis and visually verify the optimization process of least squares.
GeoGebra Commands & Parameters
Plane(O, W_{2}, W_{1}) → pSegment(Y, w) → dSegment(P_{1}, Q_{1}) → gSegment(Q_{2}, P_{2}) → hSegment(Q_{3}, P_{3}) → i
AI Drawing Prompt Reference
Draw a linear regression graph on a coordinate plane, fitting a line through points P1, P2, and P3 with weights w1 and w2. Use the least squares method to optimize, showing vertical distances and sum of squares. Construct a plane Ow2w1 for reference, and connect points P1 and Q1, Q2 and P2, Q3 and P3 to observe the fitting effect.
The prompt above was compiled from the original drawing commands and is for reference only.