
Lagrange Points 1 Potential Function Plot
Loading the math board and drawing, please wait…
In collections
₂ΛM 1: Lagrange Multipliers with One Constraint. Examples
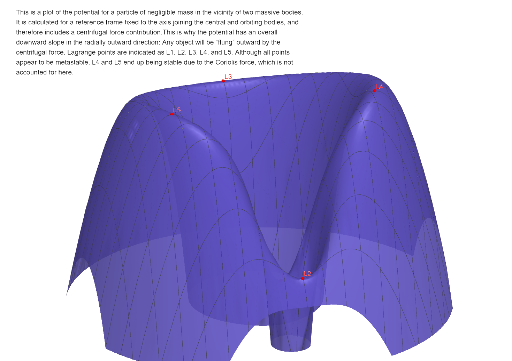
This example demonstrates the positions and properties of Lagrange points by plotting the potential function in a multi-body gravitational system. Key math concepts include gravity, potential energy, multi-body problems, and optimization. GeoGebra commands/objects used in construction are: Max (to find maxima), Min (to find minima), uoff (offset), massrat (mass ratio), mu1, mu2 (mass parameters), d (distance), xcm (center of mass), Te (total energy), m (mass), u (potential energy), Lag4, lag3max, Lag3, lag1max, Lag1, lag2max, Lag2 (Lagrange point calculations), f1, f2, f1x, f1y, f2x, f2y (force vectors), fc, fcx, fcy (central force), fx, fy, fmag (net force magnitude), zhoz, hoz (height), umax (maximum potential energy), minlags (minimum Lagrange points), Lag5, maxlags (other Lagrange points), zscale (scaling), text1, text2, text3 (text annotations). Suitable for high school and above students studying multi-body dynamics and celestial mechanics.
GeoGebra Commands & Parameters
Max(u(x, 0), (-10 * d), 0) → lag3maxMax(u(x, 0), 0, d) → lag1maxMax(u(x, 0), d, (10 * d)) → lag2maxMax(u(x, 0), -10, 10) → umaxMin({z(Lag1), z(Lag2), z(Lag3), z(Lag4)}) → minlagsMax({z(Lag1), z(Lag2), z(Lag3), z(Lag4)}) → maxlags
AI Drawing Prompt Reference
Create a plot of the gravitational potential function for a multi-body system to visualize Lagrange points. First define the mass parameters and the distance scale, then compute the potential u(x,0) along the horizontal axis. Mark the three potential maxima found over specified x-intervals (including a negative offset interval, the interval from 0 to a positive offset, and a larger positive range), and also indicate the overall maximum potential energy level. Then evaluate the potential heights at four Lagrange points and mark the minimum and maximum among them. Add a few text annotations to clarify what the Lagrange points and the potential extrema represent.
The prompt above was compiled from the original drawing commands and is for reference only.