
Large vs Small Circle Center Estimation
Loading the math board and drawing, please wait…
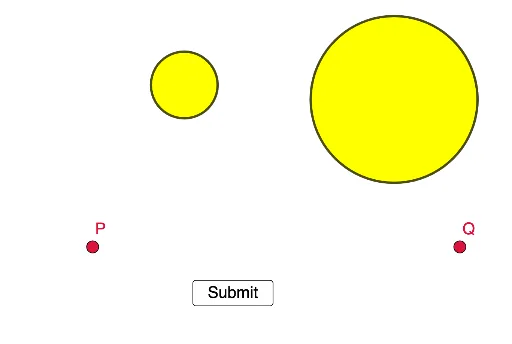
This example demonstrates the visual perception challenge of estimating circle centers by comparing small and large circles. It involves core math concepts like probability & statistics, geometric intuition, and visual perception. Constructed using GeoGebra commands like Polygon, RandomPointIn, Circle, and Segment. Suitable for high school and above students to explore statistical characteristics and geometric constructions.
GeoGebra Commands & Parameters
Polygon(G, H, 4) → poly2, j, k, l, m, I, JPolygon(C, D, 4) → poly1, f, g, h, i, E, FRandomPointIn(poly1) → ACircle(A, 2) → cRandomPointIn(poly2) → BCircle(B, 5) → dSegment(P, A) → PASegment(Q, B) → QB
AI Drawing Prompt Reference
Draw two quadrilaterals, pick a random point from each, and draw a circle with radius 2 centered at one point and another circle with radius 5 centered at the other. Connect the remaining vertices of the quadrilaterals to the random points inside the circles to visualize the visual perception challenge of estimating circle centers.
The prompt above was compiled from the original drawing commands and is for reference only.