
Introduction to Functions: Exploring Input-Output Relationships
Loading the math board and drawing, please wait…
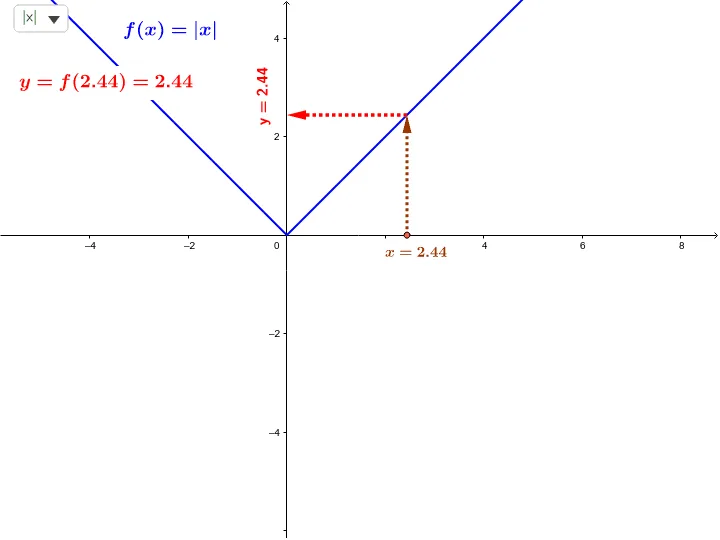
This example demonstrates the fundamental concept of functions by showing how input values of x result in output values of y. Key mathematical concepts include function definition, input-output relationships, and graphical representation. Construction involves using GeoGebra commands such as SelectedIndex, Element, Point, Vector, and others to create function graphs and arrows indicating information flow. Suitable for middle school students or high school students to understand dynamic changes in function graphs and develop graphical thinking skills in mathematics.
GeoGebra Commands & Parameters
SelectedIndex(flist) → nfElement(flist, nf) → gPoint(xAxis) → AVector(A, B) → uVector(B, C) → vVerticalText(text5) → text6Textfield(f_{13}) → inputBox1Defined(fxa) → a
AI Drawing Prompt Reference
Draw a function graph where input x values correspond to output y values. First, select a function from the list, then create a point A on the x-axis and draw two vectors u and v to represent the input and output relationship. Finally, add a text below the x-axis to explain how input x values are transformed into y values through the function.
The prompt above was compiled from the original drawing commands and is for reference only.