
Interactive Vector Equation of a Line in 3D
Loading the math board and drawing, please wait…
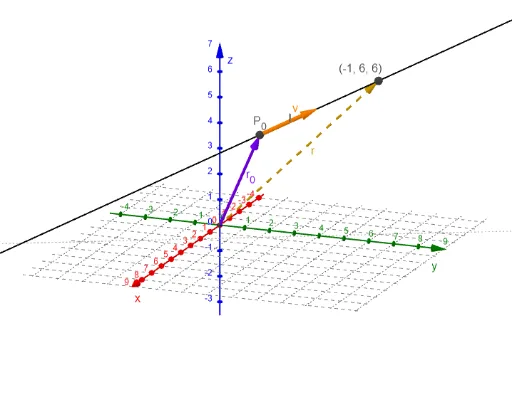
This GeoGebra example dynamically illustrates the vector equation of a line in three-dimensional space, showing how any point on the line is generated by a position vector plus a scalar multiple of a direction vector. The core mathematical concepts include vectors, parametric equations, 3D coordinate geometry, and the relationship between lines and planes. The construction uses the Vector command to define the direction and position vectors, the Line command to draw the line, and Textfield/InputBox controls to adjust the parameter t, the initial point coordinates, and the direction vector components, allowing real-time observation of point P moving along the line. It is suitable for senior high school or early university students learning spatial analytic geometry, and also serves as an effective classroom demonstration tool for teachers to explain the geometric meaning of the parameter t in the vector equation.
GeoGebra Commands & Parameters
Vector(P_0) → r_0Vector(P_0, P_0 + dir) → vLine(P_0, A) → lVector(P) → rTextfield(x_0) → InputBox2Textfield(y_0) → InputBox3Textfield(z_0) → InputBox4Textfield(a) → InputBox1Textfield(b) → InputBox5Textfield(c) → InputBox6Line((x_0, y_0, 0.00001), (x_0 + a, y_0 + b, 0.00001)) → f
AI Drawing Prompt Reference
Draw a line in 3D space defined by a position vector from an adjustable initial point and a direction vector with adjustable components. Include a parameter slider that moves a point along the line, showing its position vector as an arrow. Also display the initial point vector and direction vector as arrows. Add a horizontal auxiliary line on the xy-plane to show the projection of the moving point. The visualization should clearly illustrate how the parameter changes the point's location along the line.
The prompt above was compiled from the original drawing commands and is for reference only.