
Triple Integral in Cylindrical Coordinates - Visualizer
Loading the math board and drawing, please wait…
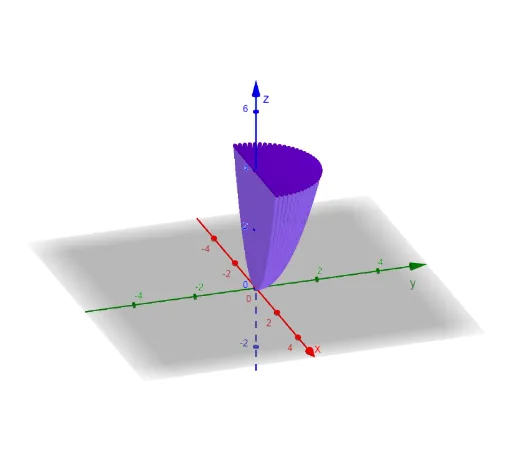
This example demonstrates the geometric interpretation of calculating a triple integral in cylindrical coordinates, visually showing the volume relationship between the integral region and the integrand function. Core math concepts include cylindrical coordinates, triple integrals, definite integrals, geometric mean, cubes, exponential functions, etc. Construction highlights involve GeoGebra commands like Textfield, Sequence, sliders, and input boxes to dynamically control parameters α, β, r_1, r_2, etc., adjusting the integral region and function graph. Suitable for high school students and math enthusiasts to intuitively understand and calculate triple integrals.
GeoGebra Commands & Parameters
Textfield(α) → InputBox1Textfield(β) → InputBox2Textfield(r_1) → InputBox3Textfield(r_2) → InputBox4Textfield(u_1) → InputBox5Textfield(u_2) → InputBox6Sequence(Sequence[Segment[((r * cos(t)), (r * sin(t)), u_1(r, t)), ((r * cos(t)), (r * sin(t)), u_2(r, t))], r, r_1(t), r_2(t), Dr], t, α, β, Dt) → l1Sequence(Sequence[((r * cos(t)), (r * sin(t)), u_2(r, t)), r, r_1(t), r_2(t), Dr], t, α, β, Dt) → l2
AI Drawing Prompt Reference
Visualize a 3D graph showing the geometric interpretation of a triple integral in cylindrical coordinates. Include a dynamically adjustable integral region and a function graph that changes with parameters α, β, r1, r2, etc., controlled by sliders and input boxes, to intuitively display the volume relationship between the integral region and the integrand function.
The prompt above was compiled from the original drawing commands and is for reference only.