
Interactive Investigation of Gradient and Y-intercept in Linear Function y=mx+c
Loading the math board and drawing, please wait…
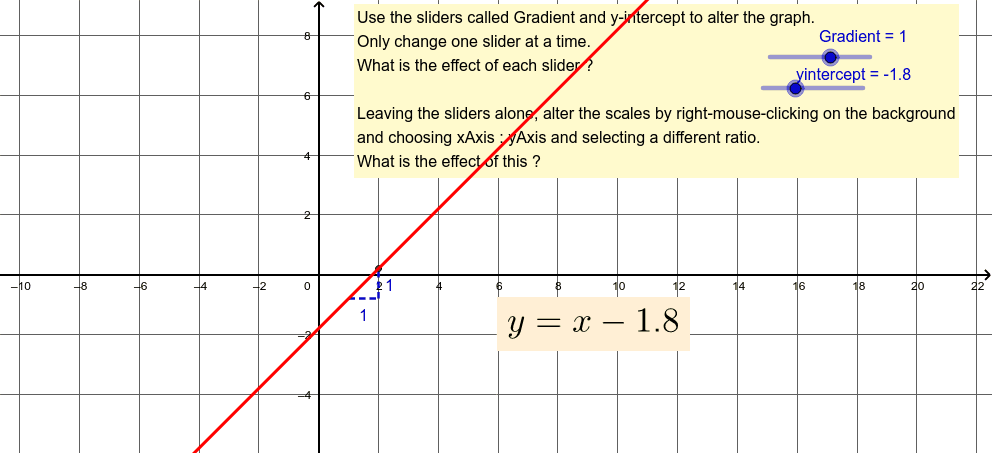
This GeoGebra applet provides an interactive exploration of how the gradient (slope) m and y-intercept c determine the position and orientation of a linear function y=mx+c on the coordinate plane. The example demonstrates a dynamic straight line that can be manipulated to visualize how slope affects the line's steepness and direction, while the y-intercept controls its vertical position. Key mathematical concepts covered include: linear function representation, geometric interpretation of gradient as rise over run, the meaning of y-intercept as the point where the line crosses the y-axis, and the relationship between parameter values and line characteristics. Construction details: uses GeoGebra commands Segment to construct reference line segments, Gradient command to calculate and display the slope value, yintercept command to compute the y-intercept, and parameter sliders (a, b, c) to adjust the values of m and c in real-time. This interactive tool is ideal for middle school to high school mathematics students learning about linear functions, enabling hands-on investigation of how changing parameters affects the graph's shape and position.
GeoGebra Commands & Parameters
Segment(A, (x(B), y(A))) → bSegment((x(B), y(A)), B) → c