
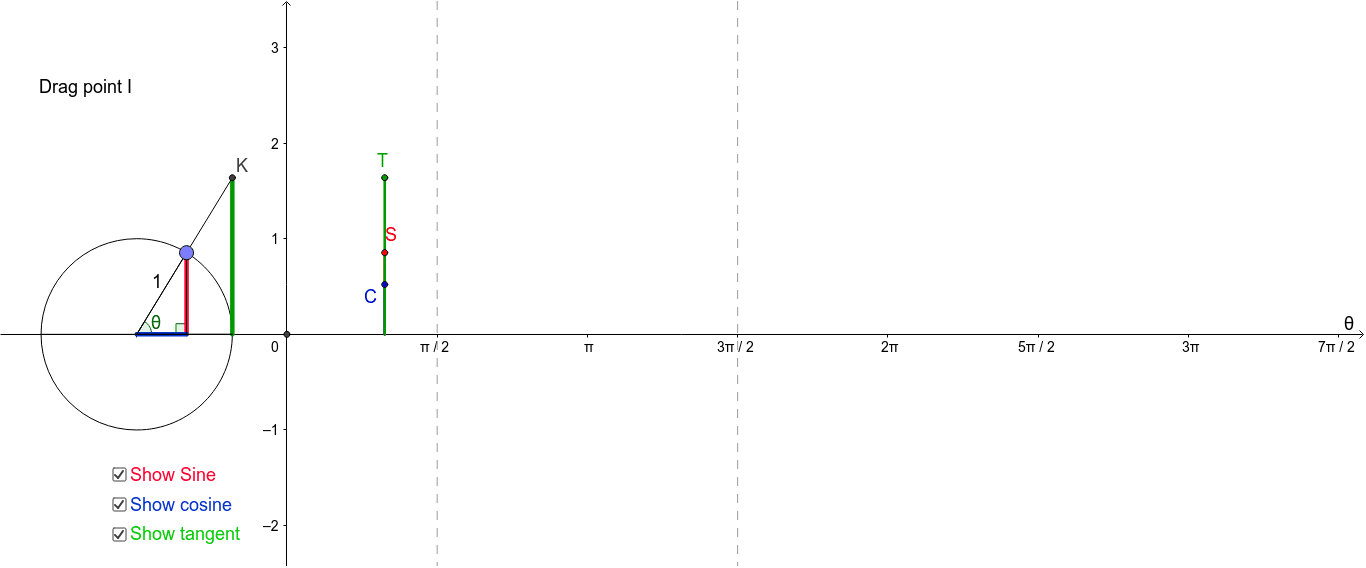
Graphs of sin, cos, and tan generated from a circle
Loading the math board and drawing, please wait…
This example demonstrates how to generate the graphs of sine, cosine, and tangent functions using the geometric properties of a unit circle. Core mathematical concepts include the unit circle, trigonometric functions, geometric transformations, function graphs, and continuity. The construction involves GeoGebra commands/objects such as Intersect, Circle, Point, Line, OrthogonalLine, Segment, Tangent, Angle, and Polygon. Suitable for high school mathematics, university preparatory courses, trigonometric function teaching, and geometric intuitive understanding.
GeoGebra Commands & Parameters
Intersect(xAxis, yAxis) → OCircle(G, 1) → pPoint(p) → HLine(G, H) → qPoint(p) → ILine(G, I) → rOrthogonalLine(I, q) → sIntersect(s, q) → JSegment(J, I) → tSegment(G, J) → a_1Tangent(H, p) → b_1,Intersect(r, b_1) → KSegment(H, K) → c_1Angle(H, G, I) → θSegment(G, K) → aSegment(G, I) → bSegment(G, H) → cOrthogonalLine(S, xAxis) → dIntersect(d, xAxis) → ASegment(S, A) → eSegment(A, C) → fSegment(A, T) → gSegment(J, I) → kAngle(I, J, G) → αIntersect(p, q) → B, DSegment(D, B) → lAngle(G, J, I) → γPolygon(E, F, 4) → poly1, d_1, e_1, f_1, g_1, L, M
AI Drawing Prompt Reference
Draw a unit circle and mark its center and intersections with the x-axis and y-axis. From the center, draw a line to a point on the circle, then a perpendicular line from that point to the first line, forming a right triangle. Use the sides and angles of this triangle to plot the graphs of sine, cosine, and tangent functions, showing their geometric relationship to the unit circle.
The prompt above was compiled from the original drawing commands and is for reference only.