
Interactive Exploration of Vertex Form of Quadratic Relations (QR2-03-P2a-XT1)
Loading the math board and drawing, please wait…
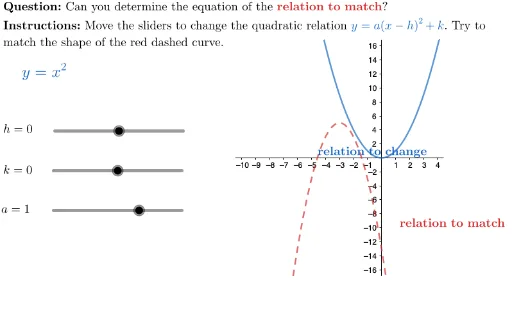
① This GeoGebra example dynamically demonstrates the vertex form of a quadratic function y = a(x - h)² + k, showing how parameters a, h, and k affect the parabola's opening direction, width, and vertex position. ② The core mathematical concepts include the vertex form of quadratic functions, transformations (horizontal/vertical shifts via h and k, vertical stretch/compression and reflection via a), and the connection between algebraic expressions and graphical representations. ③ Construction highlights: sliders (sliderLblK, sliderLblH, sliderLbla) control parameters; If statements and DynamicCoordinates provide interactive feedback; LaTeX is used to display formulas (displayFormula, eqnADisp, eqnXminusH, eqnPlusK); correctness indicators (correct, incorrect, xmark, cmark) and buttons (TryAnother, HowDidIDo) support practice and hints. ④ Suitable for upper middle school or high school students, this example helps learners grasp the geometric meaning of the vertex form, and serves as a classroom exploration or self-study tool to strengthen the connection between algebraic and graphical reasoning.
GeoGebra Commands & Parameters
UnicodeToLetter(10007) → xmarkUnicodeToLetter(10003) → cmarkDynamicCoordinates(K, If[h < 4, h - 5, -1], k) → LabelPointLaTeX((("\text{\textbf{Question: }Can you determine the equation of the } " * txtFx) * "\text{?}")) → MainInstrucIf(abs(a) ≟ 1, "", If[a ≟ 0, "0", NumToImproperFrac[a]]) → eqnADispLaTeX(If[h ≟ 0, "x^2", If[h > 0, (("(x -" * h) * ")^2"), (("(x + " * abs(h)) * ")^2")]]) → eqnXminusHLaTeX(If[k ≟ 0, "", If[k < 0, ("-" * abs(k)), ("+" * k)]]) → eqnPlusKLaTeX(("\vphantom{\frac{1}{1}}y = " * If[a ≟ 0, "0", ((eqnADisp * eqnXminusH) * eqnPlusK)])) → displayFormulaLaTeX((("k = " * k) * "")) → sliderLblKLaTeX((("h =" * h) * "")) → sliderLblHLaTeX(("\vphantom{\frac{1}{1}}a = " * NumToImproperFrac[a])) → sliderLblaLaTeX("\text{\textbf{Instructions: }Move the sliders to change the quadratic relation \textcolor{1565c0}{\(y=a(x-h)^2 + k\)}. Try to} \\ \text{match the shape of the red dashed curve.") → SpecInstruc
AI Drawing Prompt Reference
Draw a quadratic function graph in vertex form y = a(x - h)² + k. Start by creating three sliders to control the values of a, h, and k. Then dynamically generate the quadratic function expression based on the slider values and display it. Finally, adjust the direction, width, and vertex position of the parabola according to the values of a, h, and k to match the graph with the expression.
The prompt above was compiled from the original drawing commands and is for reference only.