
Interactive Correlation Scatter Plot Generator
Loading the math board and drawing, please wait…
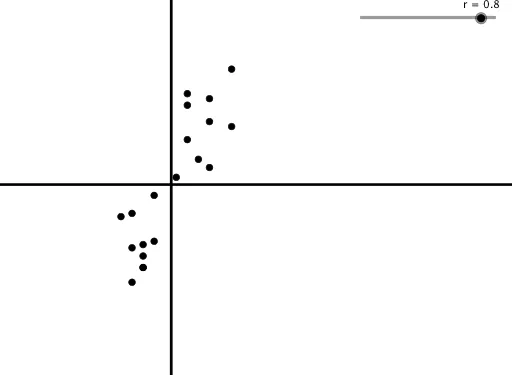
This GeoGebra activity demonstrates how to generate random scatter plots with different correlation coefficients by dynamically adjusting a slider. The core mathematical concepts include correlation coefficient, scatter plot, mean, and standard deviation. The construction uses Sequence to generate random coordinate points, Mean to calculate means (meany, meanx), SD to compute standard deviations (sdy, sdx), and performs standardization to create Xnorm and Ynorm. Then linear transformation B = r * Xnorm + sqrt(1 - r^2) * Ynorm produces scatter points with the specified correlation. Ideal for high school statistics units, teachers can use it to visually demonstrate positive correlation, negative correlation, and zero correlation, helping students understand the geometric meaning of correlation coefficients.
GeoGebra Commands & Parameters
Sequence(Random[0, 10], n, 1, 20) → YSD(Y) → sdyMean(Y) → meanySequence(Random[0, 10], n, 1, 20) → XSD(X) → sdxMean(X) → meanxSequence((X(n) - meanx) / sdx, n, 1, 20) → XnormSequence((Y(n) - meany) / sdy, n, 1, 20) → YnormSequence((Xnorm(n), Z(n)), n, 1, 20) → Points
AI Drawing Prompt Reference
Create a scatter plot with randomly generated points that demonstrate different correlation coefficients by adjusting a slider. First, generate two sets of random coordinates, calculate their means and standard deviations, then standardize the coordinates. Finally, combine the standardized coordinates through a linear transformation to create a new set of points, showing positive, negative, and zero correlations.
The prompt above was compiled from the original drawing commands and is for reference only.