
Integration by Substitution Demo
Loading the math board and drawing, please wait…
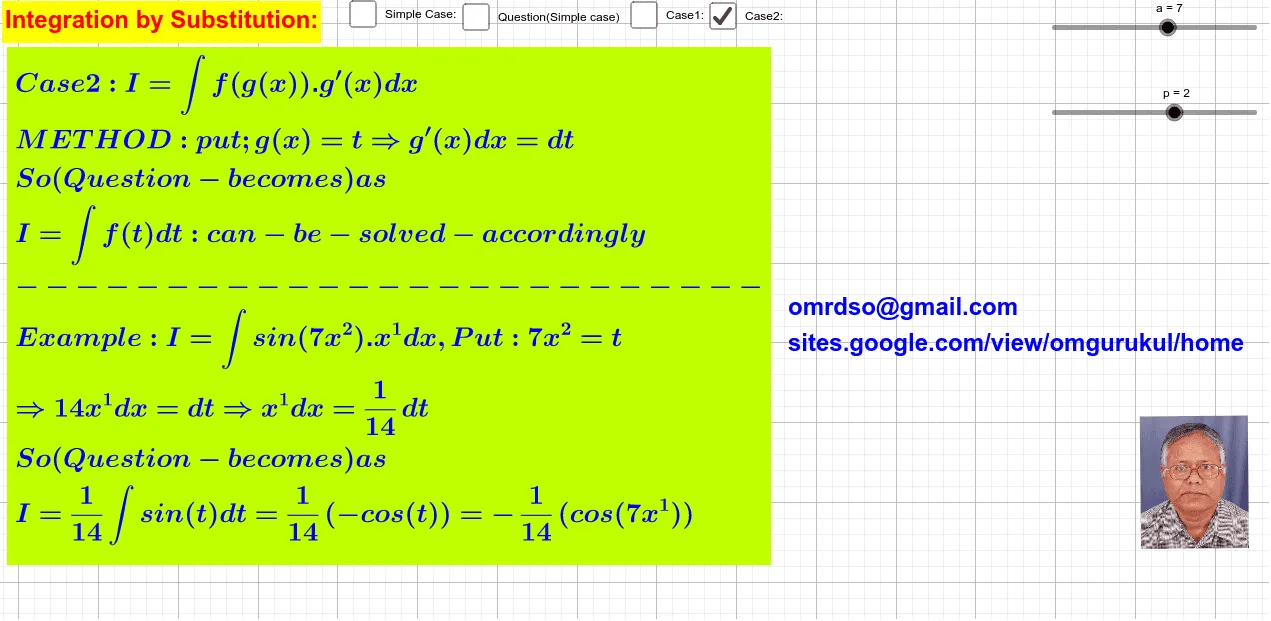
This example demonstrates the geometric and algebraic process of integration by substitution, visually showing the transformation of integral intervals through dynamic graphics. It involves core math concepts like integration, substitution, function graphs, and geometric transformations. Constructed using GeoGebra commands/objects such as text1, a, b, p, n, c, d, text2, text4, e, text3, f, A, B, pic1, text6, text5 for parameterization and visualization. Suitable for high school students and calculus education.
GeoGebra Commands & Parameters
Numeric a(7.0)Numeric b(7.0)Numeric p(2.0)Numeric n(9.0)Boolean c(false)Boolean d(true)Boolean e(false)Boolean f(false)Point A(20.141255961716237, -5.170731449042613)Point B(22.850016009980397, -5.1456503374846125)
AI Drawing Prompt Reference
Create a dynamic graphic demonstrating the geometric and algebraic process of integration by substitution, visually showing the transformation of integral intervals. Include function graphs and use sliders for parameters, with points marking key positions, to illustrate the dynamic process of integral interval transformation, suitable for high school calculus education.
The prompt above was compiled from the original drawing commands and is for reference only.