
Riemann Sum by John Golden
Loading the math board and drawing, please wait…
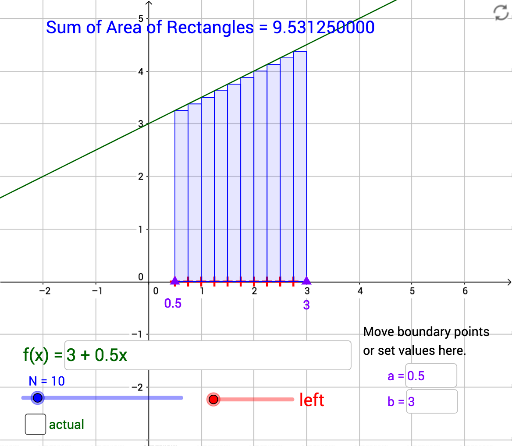
This example demonstrates the geometric interpretation of Riemann sums by dynamically partitioning intervals and calculating the sum of areas of rectangles to approximate the area under a function curve. Key mathematical concepts include Riemann sums in calculus, definite integrals, function graphs, and interval partitioning. It uses GeoGebra commands like Point, Sequence, Sum, Textfield, and Integral to create dynamic rectangles and compute their sum, with a slider to control the number of partitions N. Suitable for high school students and above learning introductory calculus concepts or visualizing the geometric meaning of definite integrals.
GeoGebra Commands & Parameters
Point(xAxis) → APoint(xAxis) → BSequence(A + ((i - 1) / N * (B - A)) + (r * (B - A) / N), i, 1, N) → list1Sequence(Polygon[A + ((i - 1) / N * (B - A)), A + (i / N * (B - A)), A + (i / N * (B - A)) + (0, f(Element[list1, i])), A + ((i - 1) / N * (B - A)) + (0, f(Element[list1, i]))], i, 1, N) → list2Sum(list2) → RSTextfield(f) → InputBox1Textfield(a) → InputBox2Textfield(b) → InputBox3Integral(f, x(A), x(B)) → actual