
Definite Integral Play 2
Loading the math board and drawing, please wait…
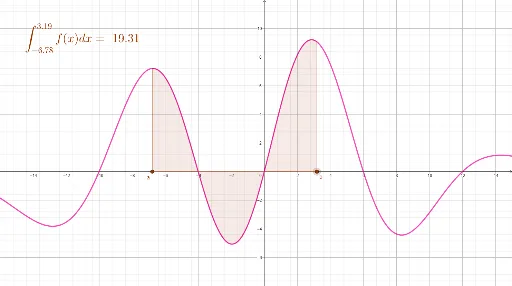
This example demonstrates the calculation and visualization of definite integrals. Core math concepts include definite integral, differential equation, normal distribution, Pythagorean theorem, circle, and indefinite integral. Construction highlights the use of GeoGebra commands Point, Integral, and objects g, a, b, f, c, text1, xmin, xmax, ymin, ymax. Suitable for high school and above students to learn and understand the application of integrals.
GeoGebra Commands & Parameters
Point(xAxis) → aPoint(xAxis) → bIntegral(f, x(a), x(b)) → c
AI Drawing Prompt Reference
Draw a function curve on a coordinate system and set two sliders to represent the upper and lower limits of the integral. Based on these two points, shade the area under the function curve corresponding to the definite integral. Display the calculation result of the definite integral and the function expression in appropriate positions on the graph to observe how the integral value changes with the limits.
The prompt above was compiled from the original drawing commands and is for reference only.