
Improper Fractions Visualized: From Circles and Sectors to Number Line
Loading the math board and drawing, please wait…
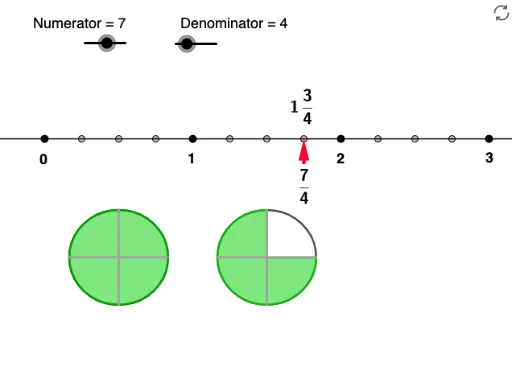
① This GeoGebra example dynamically visualizes improper fractions (where the numerator exceeds the denominator) by representing them as circles, sectors, segments, and points on a number line, making their magnitude and composition intuitive. ② Core mathematical concepts include improper fractions and mixed numbers, locating fractions on a number line, partitioning and accumulating unit '1's, and mapping fractions to geometric figures such as circles, sectors, and line segments. ③ Construction highlights: from the summary, commands used include Rotate, Intersect, Point, Line, Vector, Sequence, Mod, Div, Circle, Segment, and CircleSector; objects include F1 through F10, Numerator and Denominator sliders, lists list1 and list2, and multiple text labels (text1 to text9), allowing real-time updates of the graphics as the numerator and denominator change. ④ Suitable for upper elementary to middle school students learning fraction concepts and geometric representations, and for teachers demonstrating or students exploring the relationship between improper fractions and mixed numbers.
GeoGebra Commands & Parameters
Rotate(F1, (2 * π / Denominator), F) → F2Rotate(F2, (2 * π / Denominator), F) → F3Rotate(F3, (2 * π / Denominator), F) → F4Rotate(F4, (2 * π / Denominator), F) → F5Rotate(F5, (2 * π / Denominator), F) → F6Rotate(F6, (2 * π / Denominator), F) → F7Rotate(F7, (2 * π / Denominator), F) → F8Rotate(F8, (2 * π / Denominator), F) → F9Rotate(F9, (2 * π / Denominator), F) → F10Intersect(xAxis, yAxis) → APoint(xAxis) → BLine(A, B) → aVector(C, D) → uSequence((d, 0), d, 0, 100, Zoom) → list1Mod(Numerator, Denominator) → cDiv(Numerator, Denominator) → eSequence((d, 0), d, 0, 36, b) → list2Circle(F, 4) → fCircle(G, 4) → gCircle(H, 4) → hRotate(F10, (2 * π / Denominator), F) → F11Segment(F, F1) → iSegment(F, F2) → jSegment(F, F3) → kSegment(F, F4) → lSegment(F, F5) → mSegment(F, F6) → nSegment(F, F7) → pSegment(F, F8) → qSegment(F, F9) → rSegment(F, F10) → sRotate(F1, ((2 * π) * Numerator / Denominator), F) → F'CircleSector(F, F1, F') → c_1Circle(F, F1) → c_fRotate(G1, (2 * π / Denominator), G) → G2Rotate(G2, (2 * π / Denominator), G) → G3Rotate(G3, (2 * π / Denominator), G) → G4Rotate(G4, (2 * π / Denominator), G) → G5Rotate(G5, (2 * π / Denominator), G) → G6Rotate(G6, (2 * π / Denominator), G) → G7Rotate(G7, (2 * π / Denominator), G) → G8Segment(F, F11) → f_1Rotate(G8, (2 * π / Denominator), G) → G9Rotate(G9, (2 * π / Denominator), G) → G10Rotate(G10, (2 * π / Denominator), G) → G11Rotate(H1, (2 * π / Denominator), H) → H2Rotate(H2, (2 * π / Denominator), H) → H3Rotate(H3, (2 * π / Denominator), H) → H4Rotate(H4, (2 * π / Denominator), H) → H5Rotate(H5, (2 * π / Denominator), H) → H6Rotate(H6, (2 * π / Denominator), H) → H7Rotate(H7, (2 * π / Denominator), H) → H8Rotate(H8, (2 * π / Denominator), H) → H9Rotate(H9, (2 * π / Denominator), H) → H10Rotate(H10, (2 * π / Denominator), H) → H11Rotate(F11, (2 * π / Denominator), F) → F12Segment(F, F12) → tRotate(G11, (2 * π / Denominator), G) → G12Rotate(H11, (2 * π / Denominator), H) → H12Segment(G, G1) → g_1Segment(G, G2) → h_1Segment(G, G3) → i_1Segment(G, G4) → j_1Segment(G, G5) → k_1Segment(G, G6) → l_1Segment(G, G7) → m_1Segment(G, G8) → n_1Segment(G, G9) → p_1Segment(G, G10) → q_1Segment(G, G11) → r_1Segment(G, G12) → s_1Segment(H, H1) → t_1Segment(H, H2) → a_1Segment(H, H3) → b_1Segment(H, H4) → d_1Segment(H, H5) → e_1Segment(H, H6) → f_2Segment(H, H7) → g_2Segment(H, H8) → h_2Segment(H, H9) → i_2Segment(H, H10) → j_2Segment(H, H11) → k_2Segment(H, H12) → l_2Segment(F_1, F1_1) → i_3Circle(G, G1) → G_CSegment(G_2, G1_1) → g_3Circle(H, H1) → H_1Rotate(G1, ((2 * π) * Numerator / Denominator), G) → G'Rotate(H1, ((2 * π) * (Numerator - Denominator) / Denominator), H) → H'CircleSector(G, G1, G') → c_2CircleSector(H, H1, H') → d_2
AI Drawing Prompt Reference
Create a dynamic visualization of improper fractions using three equal circles, each divided into sectors based on the denominator. The first circle highlights the numerator's portion with a colored sector, the second shows all equal divisions, and the third displays the remainder. Below, draw a number line with a point marking the fraction's value, and connect the circles to this point with line segments to illustrate the relationship between improper fractions and mixed numbers. All elements update as the numerator and denominator sliders change.
The prompt above was compiled from the original drawing commands and is for reference only.