
Identifying Parameters & Statistics
Loading the math board and drawing, please wait…
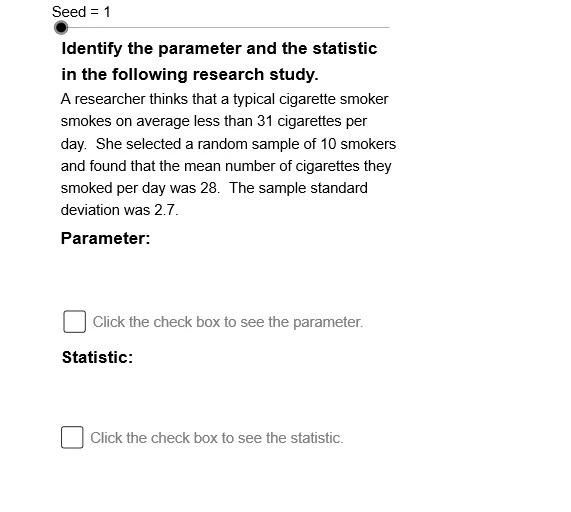
This example helps students understand key statistical concepts such as mean and median by analyzing parameters in the graph. Using GeoGebra commands, students can dynamically explore these concepts. GeoGebra objects used include St10, St09, St01, etc. Suitable for high school math education.
GeoGebra Commands & Parameters
Numeric Seed(1){RS01, RS02, RS03, RS04, RS05, RS06, RS07, RS08, RS09, RS10}{Pr01, Pr02, Pr03, Pr04, Pr05, Pr06, Pr07, Pr08, Pr09, Pr10}{St01, St02, St03, St04, St05, St06, St07, St08, St09, St10}Boolean a(false)Boolean b(false)(1, 5.7)(1, 1.7)(1, -1.2)
AI Drawing Prompt Reference
Create a statistical graph with multiple parameters to illustrate mean and median concepts, including two sets of random numbers and parameter collections, along with three fixed points, allowing dynamic exploration by adjusting parameters, suitable for high school math education involving probability and trigonometry.
The prompt above was compiled from the original drawing commands and is for reference only.