
Ice Cream Prices Simulation (Hypergeometric Distribution & Integral Demo)
Loading the math board and drawing, please wait…
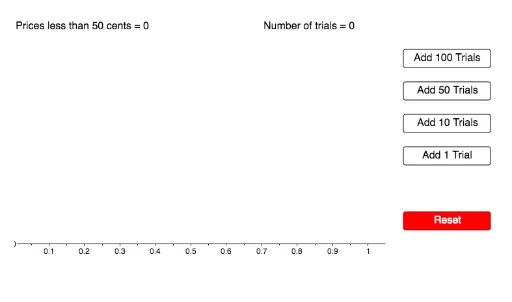
① This example simulates random ice cream prices, visualizes the price distribution with a dot plot, and demonstrates statistical simulation in an interactive way. ② Core mathematical concepts include hypergeometric distribution, random sampling, probability and statistics, as well as integral calculus and logarithmic functions applied to price modeling, along with polygon area and graphical representation. ③ Construction highlights: using GeoGebra commands Random to generate random prices, Polygon to create polygonal regions, and DotPlot for dot plots; objects include price list 'prices', buttons button1 to button5, points A/B/C/D, polygon poly1, sliders a/b/c/d, texts text1/text2, and list1, with interactive buttons controlling simulation and display. ④ Suitable for high school to undergraduate probability and statistics courses, as well as math lab sessions, helping students understand random simulation, distribution characteristics, and graphical data analysis methods.
GeoGebra Commands & Parameters
Random(1, 6) → d1Random(1, 6) → d2Polygon(A, B, C, D) → poly1, a, b, c, dDotPlot(prices, false, 0.1) → list1