
Hypothesis Testing with Binomial Distribution by Neil
Loading the math board and drawing, please wait…
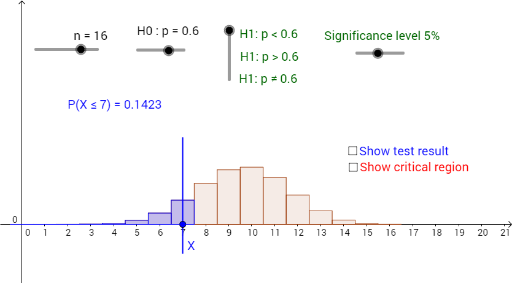
This example demonstrates hypothesis testing using the binomial distribution. It involves key mathematical concepts such as the binomial distribution, hypothesis testing, and combinatorics. Using GeoGebra commands like Sequence and BarChart, it constructs a binomial distribution probability bar chart and simulates hypothesis testing. Suitable for high school mathematics education and learning.
GeoGebra Commands & Parameters
Sequence(((Binomial[n, r] * p^(r)) * (1 - p)^(n - r)), r, 0, n) → LBarChart(-0.5, n + 0.5, L) → aSequence(Sum[L, i], i, 1, n + 1) → SBarChart(-0.5, c_1 + 0.5, Take[L, 1, c_1 + 1]) → cBarChart(c_2 - 0.5, n + 0.5, Take[L, c_2 + 1, n + 1]) → dBarChart(-0.5, c_3 + 0.5, Take[L, 1, c_3 + 1]) → fElement(S, c_3 + 1) → s_3BarChart(c_4 - 0.5, n + 0.5, Take[L, c_4 + 1, n + 1]) → gSegment(A, B) → iPoint(i) → XSegment((x(X), 0.3), (x(X), -0.1)) → jBarChart(-0.5, x(X) + 0.5, Take[L, 1, x(X) + 1]) → kElement(S, x(X) + 1) → x_1BarChart(x(X) - 0.5, n + 0.5, Take[L, x(X) + 1, n + 1]) → lElement(S, c_1 + 1) → s_1
AI Drawing Prompt Reference
Draw a binomial distribution probability bar chart with the horizontal axis representing the number of successes. First, plot the full distribution bars. Then, using two critical values, highlight the left and right rejection regions in different colors, and display their cumulative probabilities. Add a horizontal segment above the chart with a movable point representing the test statistic; draw a vertical line from this point downward, shading the left and right areas separately, and show the cumulative probability for this point.
The prompt above was compiled from the original drawing commands and is for reference only.