
Coin Flipping Frequency Experiment
Loading the math board and drawing, please wait…
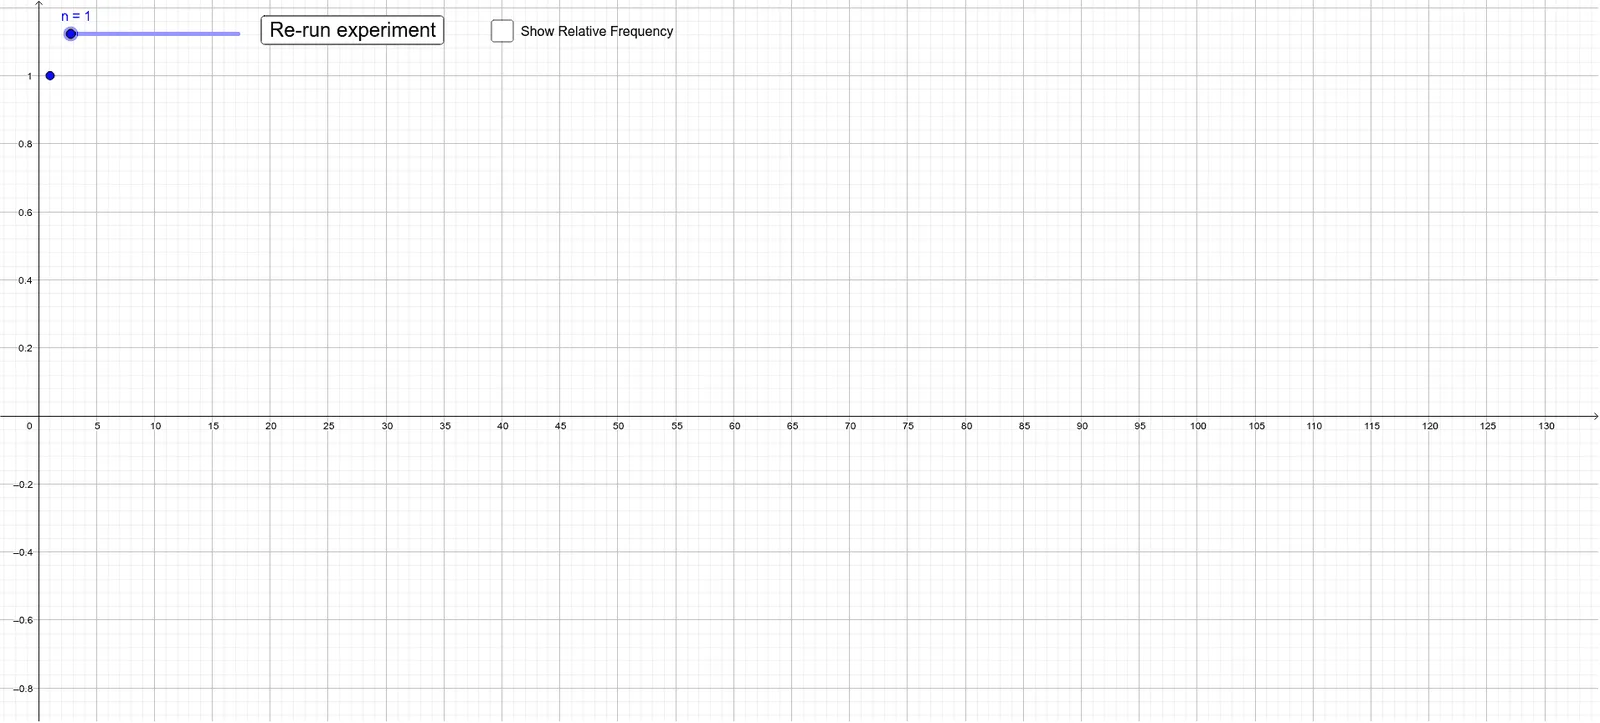
This example demonstrates a coin flipping frequency experiment, involving core concepts of probability and statistics. Using GeoGebra's random number generation and sequence commands, it dynamically shows the results of coin flips and their frequency changes. Suitable for middle school and above students to learn and explore probability and statistics.
GeoGebra Commands & Parameters
Random(0, 1) → aSequence(Random[0, 1], i, 1, 1000) → l1Sequence(Element[l1, i], i, 1, n) → l2Sequence((i, Element[l1, i]), i, 1, n) → l3Sequence(Sum[l1, i] / i, i, 1, n) → l4Sequence((i, Sum[l1, i] / i), i, 1, n) → l5
AI Drawing Prompt Reference
Create a dynamic statistical chart simulating a coin-flipping frequency experiment. Include a slider to control the total number of flips (from 1 to 1000). For each flip, the outcome is either 0 or 1, shown as a scatter plot with flip index on the x-axis and outcome on the y-axis. Additionally, plot a frequency curve where the x-axis is the flip index and the y-axis is the cumulative frequency of heads (outcome 1) up to that flip, calculated as the cumulative sum divided by the number of flips. The curve updates dynamically as the slider changes, illustrating how the frequency approaches 0.5 as the sample size increases.
The prompt above was compiled from the original drawing commands and is for reference only.