
Introducing the Normal Distribution using Hand-span
Loading the math board and drawing, please wait…
In collections
Resources for New A-level Maths Spec
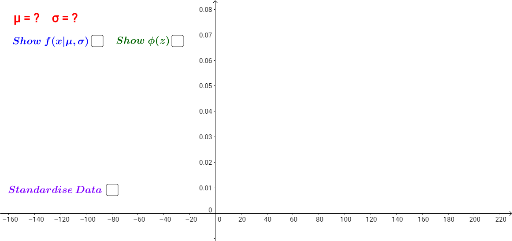
This example demonstrates the generation of the normal distribution by collecting hand-span data from students, plotting a histogram, and fitting a normal distribution curve. Key mathematical concepts include data collection, histograms, normal distribution, mean, and standard deviation. GeoGebra commands used are RemoveUndefined, Mean, Histogram, and Textfield, with objects like A36-A18, μ, σ, g, list1, a, p. Suitable for high school mathematics or introductory statistics courses to understand data distribution and normal distribution properties.
GeoGebra Commands & Parameters
RemoveUndefined({A2, A3, A4, A5, A6, A7, A8, A9, A10, A11, A12, A13, A14, A15, A16, A17, A18, A20, A21, A22, A23, A24, A25, A26, A27, A28, A29, A30, A31, A32, A33, A34, A35, A36}) → list1Mean(list1) → aRemoveUndefined({B2, B3, B4, B5, B6, B7, B8, B9, B10, B11, B12, B13, B14, B15, B16, B17, B18, B20, B21, B22, B23, B24, B25, B26, B27, B28, B29, B30, B31, B32, B33, B34, B35, B36}) → list2Histogram(list3, list1, true, 1 / Length[list1]) → cHistogram((list3 - a) / b, list2, true, 1 / Length[list2]) → fTextfield(μ) → InputBox1Textfield(σ) → InputBox2
AI Drawing Prompt Reference
Illustrate the generation of a normal distribution by collecting hand-span data from students, plot a histogram of the data, fit a normal distribution curve, and label the mean and standard deviation, displaying them next to the graph.
The prompt above was compiled from the original drawing commands and is for reference only.