
Binomial Distribution Demo by Neil
Loading the math board and drawing, please wait…
In collections
Resources for New A-level Maths Spec
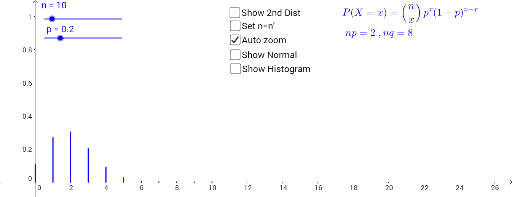
This example demonstrates the probability mass function of the binomial distribution and its approximation to the normal distribution. It involves core mathematical concepts such as binomial distribution, normal distribution, probability density function, and bar chart. The construction uses GeoGebra commands like BinomialDist, Sequence, BarChart, and Normal. Suitable for high school and above students to learn and understand key probability and statistics concepts, or for teaching demonstrations.
GeoGebra Commands & Parameters
BinomialDist(n, p) → aSequence(((Binomial[n, i] * p^(i)) * (1 - p)^(n - i)), i, 0, n) → list1Sequence(i, i, 0, n) → list2BarChart(list2, list1, 0) → bSequence(((Binomial[n', i] * p'^(i)) * (1 - p')^(n' - i)), i, 0, n') → list3Sequence(i, i, 0, n') → list4BarChart(list4, list3, 0) → cNormal((n * p), sqrt(((n * p) * (1 - p))), x) → gNormal((n' * p'), sqrt(((n' * p') * (1 - p'))), x) → qBarChart(list2, list1, 1) → iBarChart(list4, list3, 1) → k