
Hypothesis Test Power Analysis
Loading the math board and drawing, please wait…
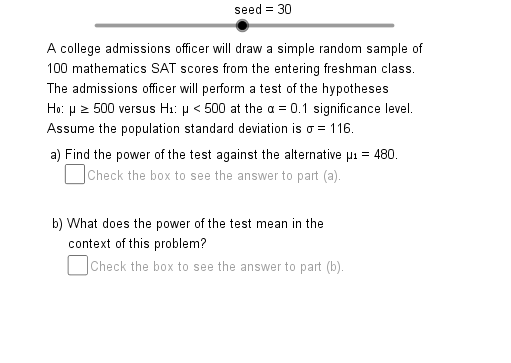
This example demonstrates how to analyze the power of a hypothesis test by adjusting parameters such as sample standard deviation and sample size. Key mathematical concepts include hypothesis testing and power analysis in probability and statistics. Using GeoGebra commands like Mod, Element, If, Normal, etc., users can dynamically adjust parameters and observe the results. Suitable for high school or university statistics courses.
GeoGebra Commands & Parameters
Mod((seed * RndFct), Cmpst) → Nmb1Element(Z2TSq, Chc3) → Zc2TElement(Z1TSq, Chc3) → Zc1TIf(Chc2 < 3, Zc1T, Zc2T) → ZcElement(AccSq, Chc1) → AccElement(NSq, Chc1) → NElement(SDSq, Chc1) → SDElement(MuSq, Chc1) → Mu0If(Mod[Chc2, 2] ≟ 0, Mu11, Mu12) → Mu1If(Mod[Chc2, 2] ≟ 0, Xc1, Xc2) → XcElement(IE1Sq, Chc2) → IE1Element(IE2Sq, Chc2) → IE2Element(AlphSq, Chc3) → AlphNormal(Mu1, SE, Xc) → PrbLfIf(Chc2 ≟ 2, PrbLf, If[Chc2 ≟ 1, PrbRt, PrbTT]) → PrbIf(Prb < 0.001, "less than 0.001", If[Prb > 0.999, "more than 0.999", ("about " * Prb)]) → PrbTxIf(Prc < 0.01, "less than 0.1%", If[Prc > 99.9, "more than 99.9%", (("about " * Prc) * "%")]) → PrcTx