
How to Draw y=ax+b Without a Table?
Loading the math board and drawing, please wait…
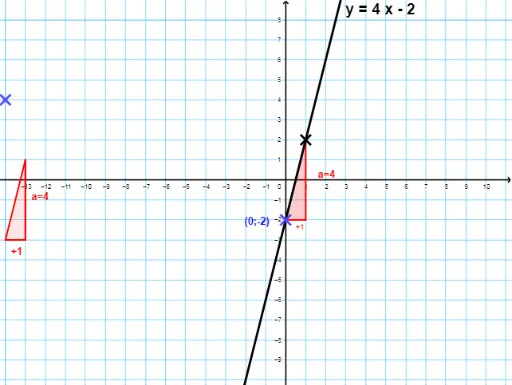
This example demonstrates how to draw the graph of a linear function y=ax+b without using a table. Key mathematical concepts include linear functions and function graphs. Using GeoGebra commands such as Textfield, Vector, Polygon, etc., you can dynamically adjust the values of a and b to observe changes in the function graph. Suitable for students at the junior high school level and above to learn about the graphs and properties of linear functions.
GeoGebra Commands & Parameters
Textfield(a) → ChampTexte1Textfield(b) → ChampTexte2Vector(A, AA) → uPolygon(D, E, F) → t1, f_1, d, eVector(D, AA) → vTranslate(D, Vector[(If[o < 5, 0, If[5 < o < 15, (o - 5) / 10, 1]] * v)]) → D'Translate(E, Vector[(If[o < 5, 0, If[5 < o < 15, (o - 5) / 10, 1]] * v)]) → E'Translate(F, Vector[(If[o < 5, 0, If[5 < o < 15, (o - 5) / 10, 1]] * v)]) → F'Polygon(D', E', F') → t1', f', d', e'Translate(A, Vector[(If[o ≤ 10, o / 10, 1] * Vector[A, AA])]) → A'Translate(AA, Vector[(If[o < 15, 0, (3 * (o - 15) / 10)] * Vector[AA, C])]) → AA'Translate(AA, Vector[(-((If[o < 15, 0, (3 * (o - 15) / 10)] * Vector[AA, C])))]) → AA'_1Segment(AA', AA'_1) → gMidpoint(E, F) → GMidpoint(E', F') → HVector(K, L) → cVector(I, M) → wMidpoint(D, E) → N
AI Drawing Prompt Reference
Draw the graph of the linear function y=ax+b, where a and b can be adjusted through input fields. First, create input fields for a and b, then use vectors and polygons to draw the line. Finally, dynamically adjust the line's position to observe how changes in a and b affect the line.
The prompt above was compiled from the original drawing commands and is for reference only.