
Horizontal and Vertical Transformations: Exploring af(b(x-c))+d
Loading the math board and drawing, please wait…
In collections
Grade 12 PreCalculus BC
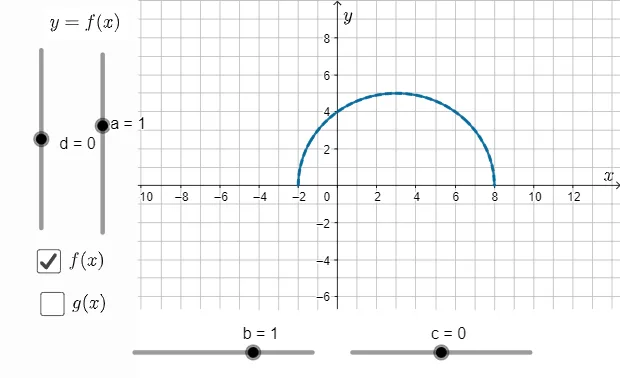
① This interactive GeoGebra example dynamically demonstrates how parameters a, b, c, and d in the general function y = af(b(x-c))+d affect the graph through horizontal and vertical transformations, including stretching, compressing, shifting, and reflection. ② Core mathematical concepts include affine transformations of function graphs, amplitude, period, phase shift, vertical translation, and mirror effects caused by sign changes. ③ Construction highlights: using GeoGebra commands If and Text to create dynamic labels, defining sliders for parameters a, b, c, d, constructing function objects g and f, and using text objects like gtext and ftext to display the transformation formula in real time, with vscale and hscale controlling axis scaling for interactive exploration. ④ Suitable for high school and pre-university students learning function transformations, as well as teachers for classroom demonstrations, helping learners understand how parameters alter graph shape and position and fostering visual-mathematical thinking.
GeoGebra Commands & Parameters
If(b ≟ 1, "", If[b ≟ -1, "-", Text[b]]) → btextIf(a ≟ 1, "", If[a ≟ -1, "-", Text[a]]) → atextIf(d ≟ 0, "", If[d < 0, Text[d], ("+" * Text[d])]) → dtextIf(b < 0, 4 / ((-b)) + c, 4 / b + c) → grightIf(b < 0, 4 / b + c, -4 / b + c) → gleftText(abs(c)) → absctextIf(c ≟ 0, gtext0, If[c < 0, gtextpc, gtextmc]) → gtextIf(c ≟ 0, ftextc0, If[c < 0, ftextpc, ftextmc]) → ftextIf(b < 0, -8 / ((-b)) + c, -2 / b + c) → fleftIf(b < 0, 2 / ((-b)) + c, 8 / b + c) → fright
AI Drawing Prompt Reference
Draw a function graph to show how parameters a, b, c, d affect the function y = af(b(x-c))+d, including horizontal compression/stretching, left-right shifts, vertical shifts, and x-axis reflection. Use sliders to control the parameters, dynamically display the function formula and parameter values, and use different colors to distinguish the original function and the transformed function.
The prompt above was compiled from the original drawing commands and is for reference only.