
Exploring Polynomial Functions and Their Graphs
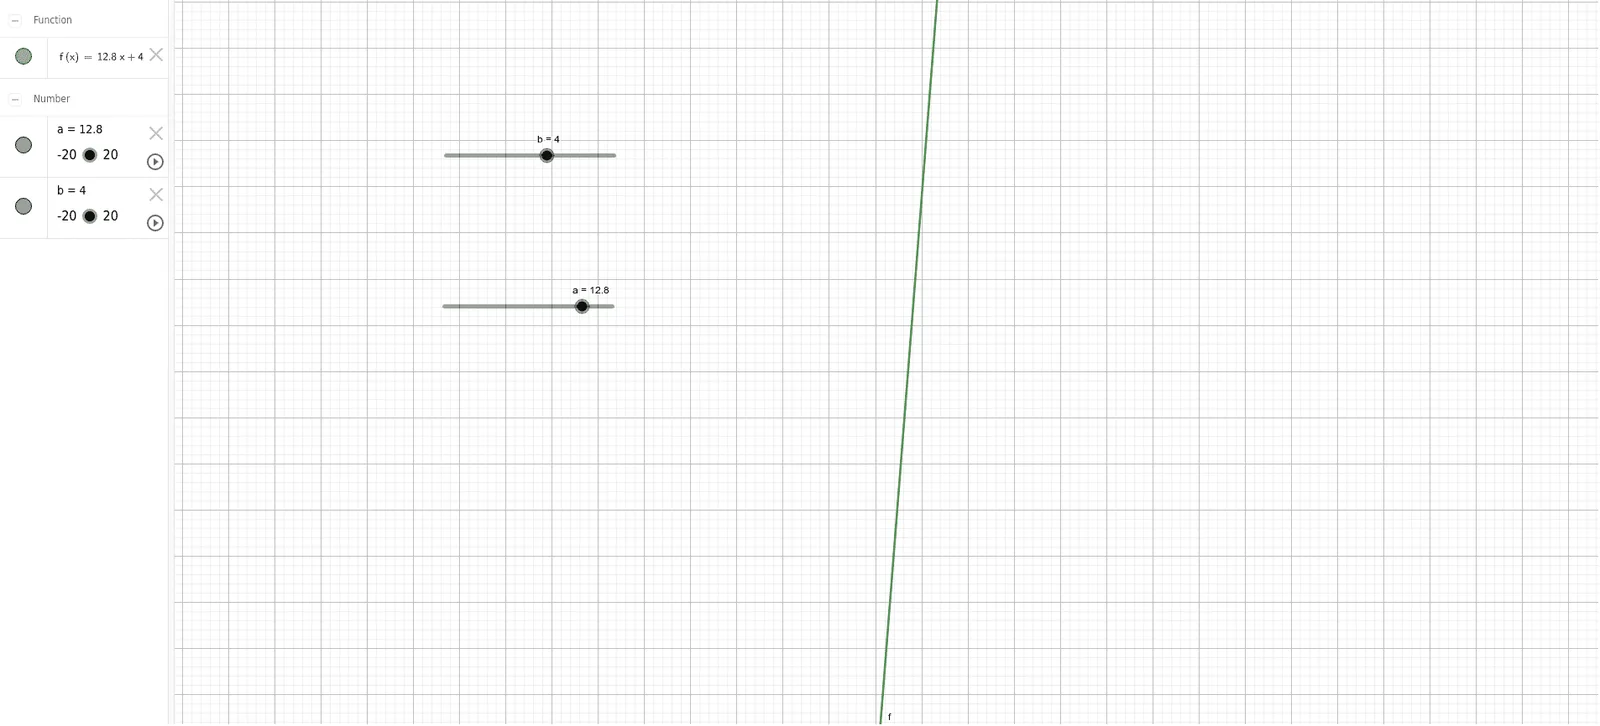
This interactive example demonstrates how the graph of a polynomial function changes dynamically as its coefficients vary. It covers core mathematical concepts such as degree, leading coefficient effects, end behavior, and connections to calculus (e.g., critical points via derivatives). The construction uses GeoGebra objects: parameters 'a' and 'b' (typically implemented as sliders) to control coefficients of the polynomial function 'f', enabling real-time visualization. Additional elements like reflections and matrix transformations may be integrated to illustrate broader mathematical links. Suitable for high school algebra/precalculus instruction, early university calculus courses, or exploratory learning in mathematical modeling, this applet supports inquiry into functional behavior, parameter sensitivity, and interdisciplinary concept integration.
Loading the math board and drawing, please wait…