
Honeybee Population Growth Rate (Calculus Dynamic Illustration)
Loading the math board and drawing, please wait…
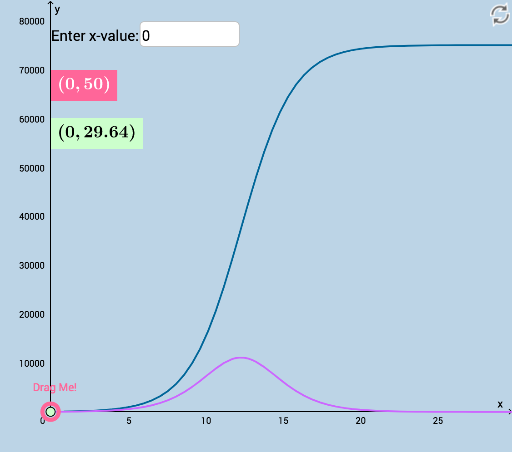
This example dynamically illustrates the growth rate of honeybee populations, focusing on calculus concepts like derivatives, exponential functions, and function graphing. It constructs key elements using GeoGebra commands such as Textfield, Segment, and objects like f, P, a, A, P', B, InputBox1, g, text1, text2, making it suitable for Calculus I or introductory mathematical modeling courses.
GeoGebra Commands & Parameters
Textfield(a) → InputBox1Segment(A, B) → g