
Histogram with Polygon
Loading the math board and drawing, please wait…
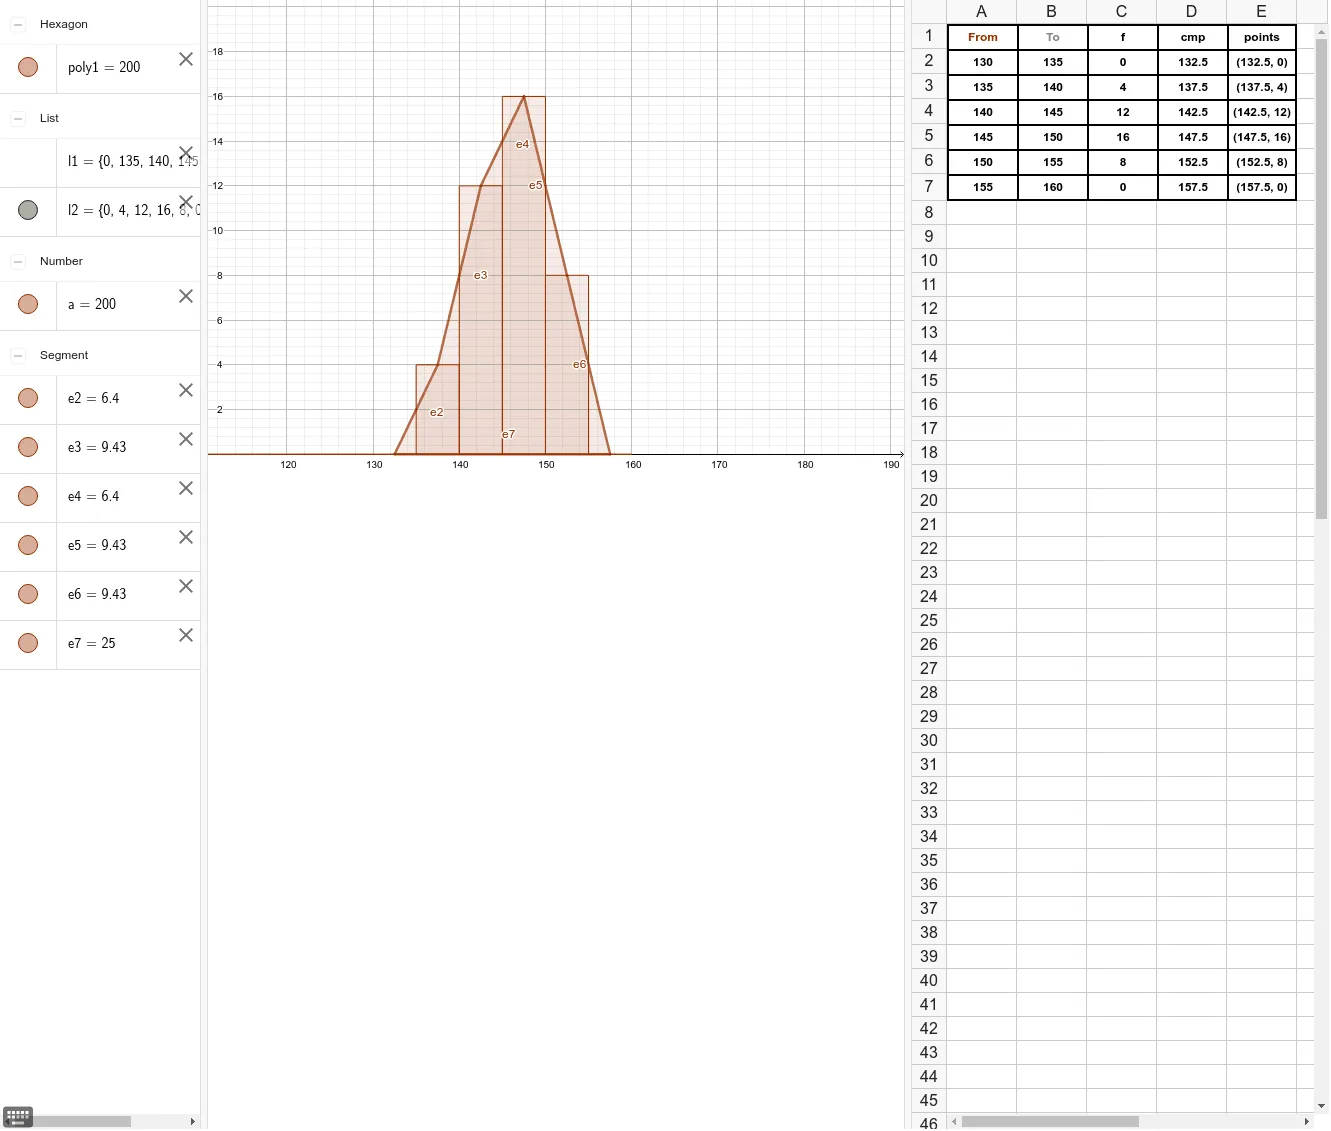
This example demonstrates the creation of a histogram and polygon. Key mathematical concepts include statistics, random variables, and polygon construction. Using GeoGebra commands such as Histogram and Polygon, it visually represents data distribution. Suitable for high school and above students or teachers for teaching and learning.
GeoGebra Commands & Parameters
Histogram(l1, l2) → aPolygon(E2, E3, E4, E5, E6, E7) → poly1, e2, e3, e4, e5, e6, e7
AI Drawing Prompt Reference
Draw a histogram and overlay a polygon on it to visualize the combination of data distribution and geometric shape, first create the histogram, then connect six points in sequence to form a polygon, making it cover part of the histogram to illustrate the connection between statistics and geometry.
The prompt above was compiled from the original drawing commands and is for reference only.