
Exercise 9 Solution: Variance, Median, and Pie Chart in a Cube
Loading the math board and drawing, please wait…
In collections
geometriadinamica.es
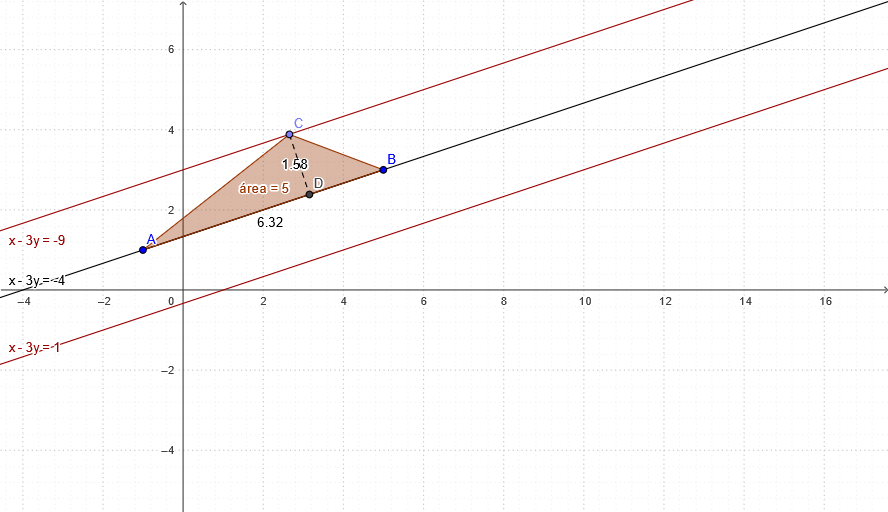
This example demonstrates how to combine statistical concepts such as variance, median, and random variables with a three-dimensional cube geometry, and visualize the results using a pie chart. The core mathematical concepts include descriptive statistics (variance, median) and the interpretation of statistical graphs. Construction highlights: using GeoGebra commands Segment, Point, Polygon, OrthogonalLine, and Intersect, the cube and its internal auxiliary lines are constructed, involving objects A, B, b, a, c, C, área, c_1, a_1, b_1, d, D, e, f. This helps to intuitively understand statistical calculations through geometric construction. Suitable for high school or early college students learning probability and statistics combined with solid geometry, and useful for teachers demonstrating spatial visualization of statistical concepts.
GeoGebra Commands & Parameters
Segment(B, A) → bPoint(c) → CPolygon(A, B, C) → área, c_1, a_1, b_1OrthogonalLine(C, a) → dIntersect(d, a) → DSegment(C, D) → e
AI Drawing Prompt Reference
Draw a three-dimensional cube and construct auxiliary lines inside it. The cube is defined by points A, B, and C, forming a triangular face. Draw a perpendicular line from point C to line a, intersecting line a at point D. Then connect point C and point D to form a line segment. Ensure the drawing is clear, showing the geometric structure of the cube and the interaction of the auxiliary lines.
The prompt above was compiled from the original drawing commands and is for reference only.