
Histogram Layout
Loading the math board and drawing, please wait…
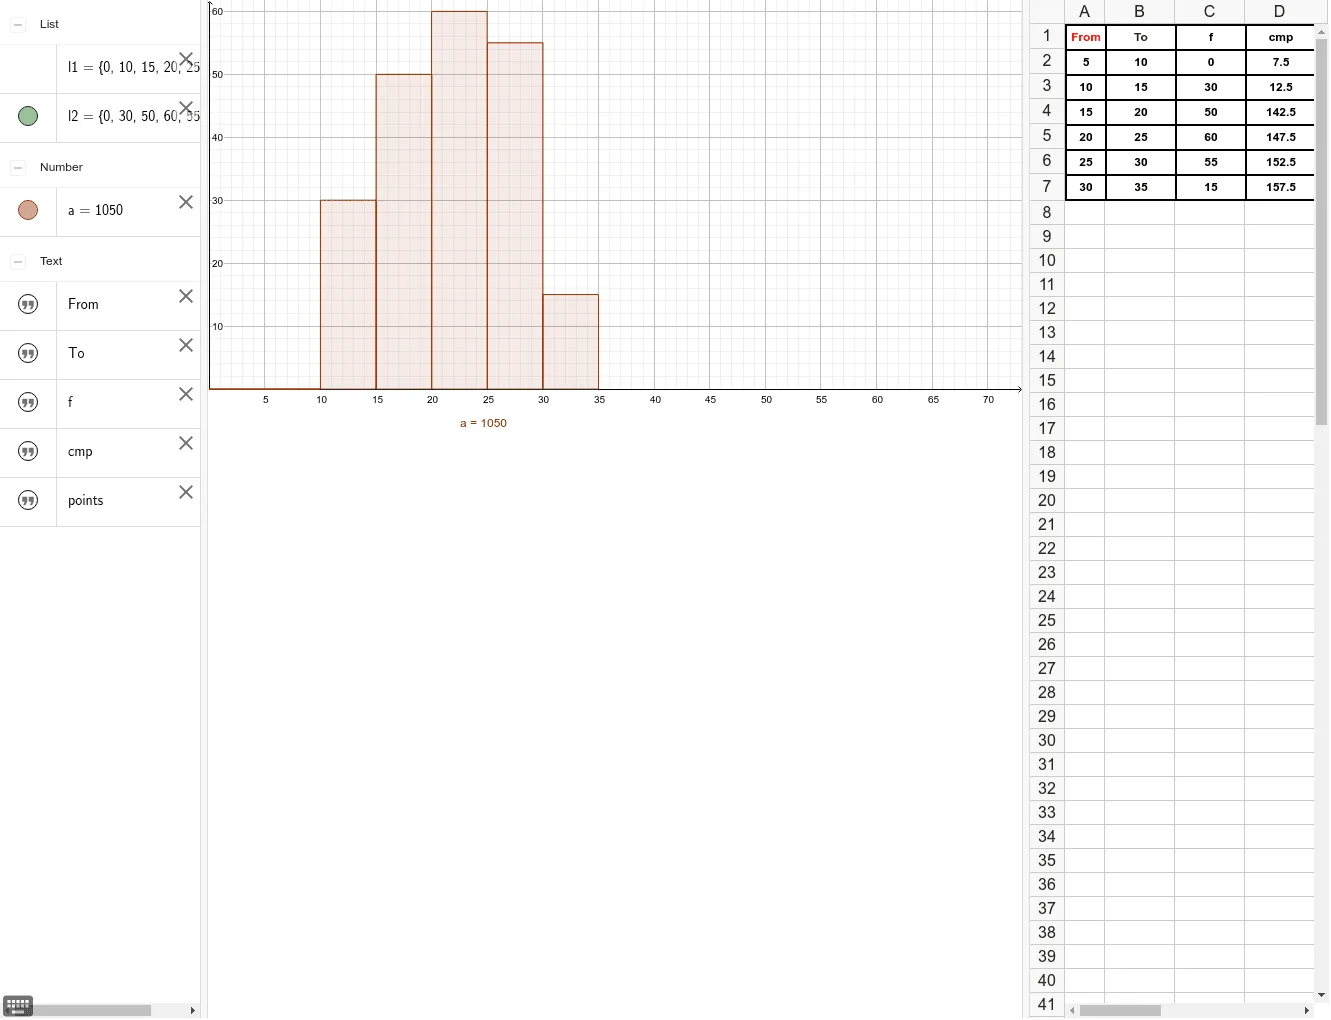
This example demonstrates the layout of a histogram. It involves the statistical concept of histograms and shows how to create a histogram using the Histogram command in GeoGebra. Key construction points include the use of the Histogram command and data objects A1 to D7. Suitable for statistics education to help students understand data distribution and histogram construction.
GeoGebra Commands & Parameters
Histogram(l1, l2) → a
AI Drawing Prompt Reference
Draw a histogram showing data distribution, using two sets of data to generate different parts of the histogram, presenting a statistical chart layout style to help understand how data is grouped and displayed in the coordinate system.
The prompt above was compiled from the original drawing commands and is for reference only.